Fig. 6.
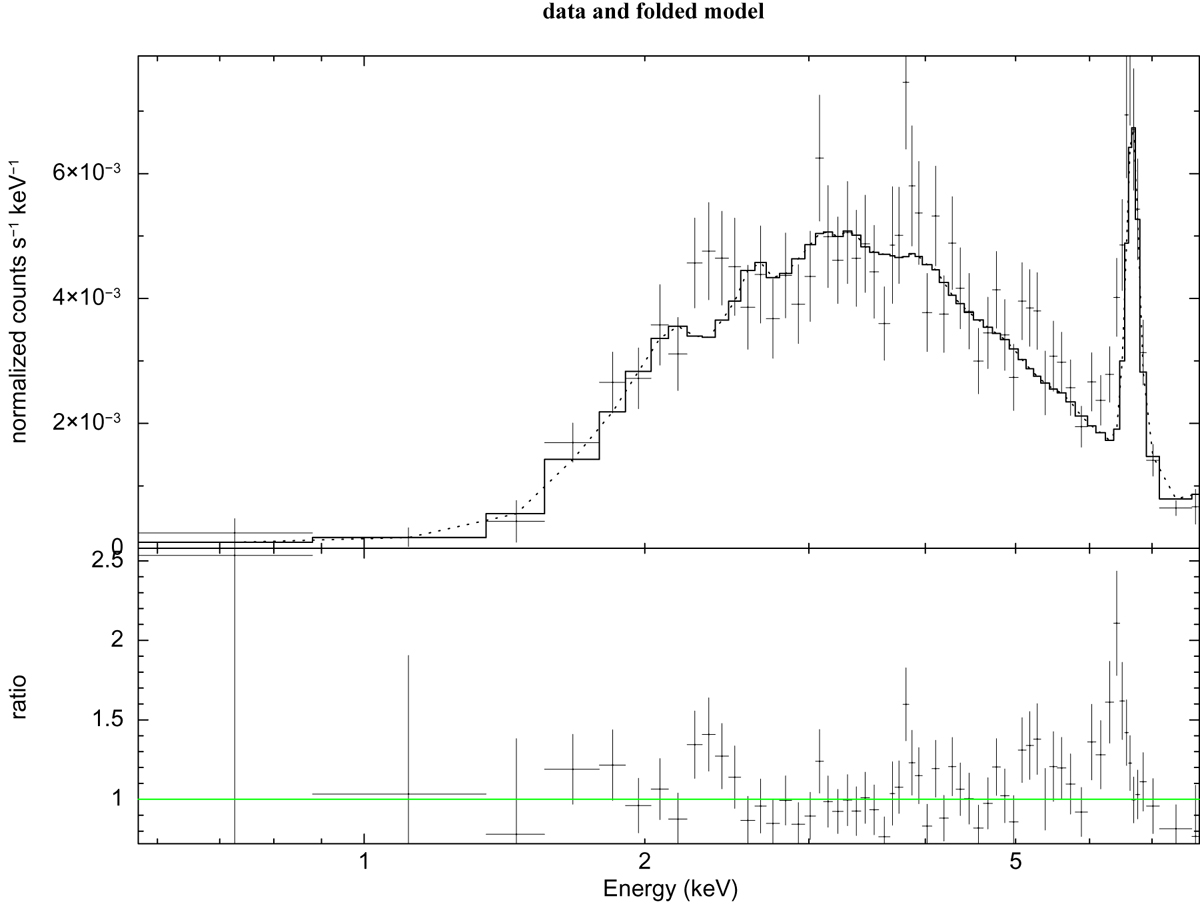
Spectrum of the PN during the quiescent phase (top panel) and ratio data/model. The spectrum was accumulated from events collected during the quiescent phases after the flare and in the third XMM-Newton observation. The model is an absorbed APEC thermal component. A sharp excess of emission is visible at ∼6.4 keV and due to the fluorescent emission present even during quiescence.
Current usage metrics show cumulative count of Article Views (full-text article views including HTML views, PDF and ePub downloads, according to the available data) and Abstracts Views on Vision4Press platform.
Data correspond to usage on the plateform after 2015. The current usage metrics is available 48-96 hours after online publication and is updated daily on week days.
Initial download of the metrics may take a while.