Fig. 4.
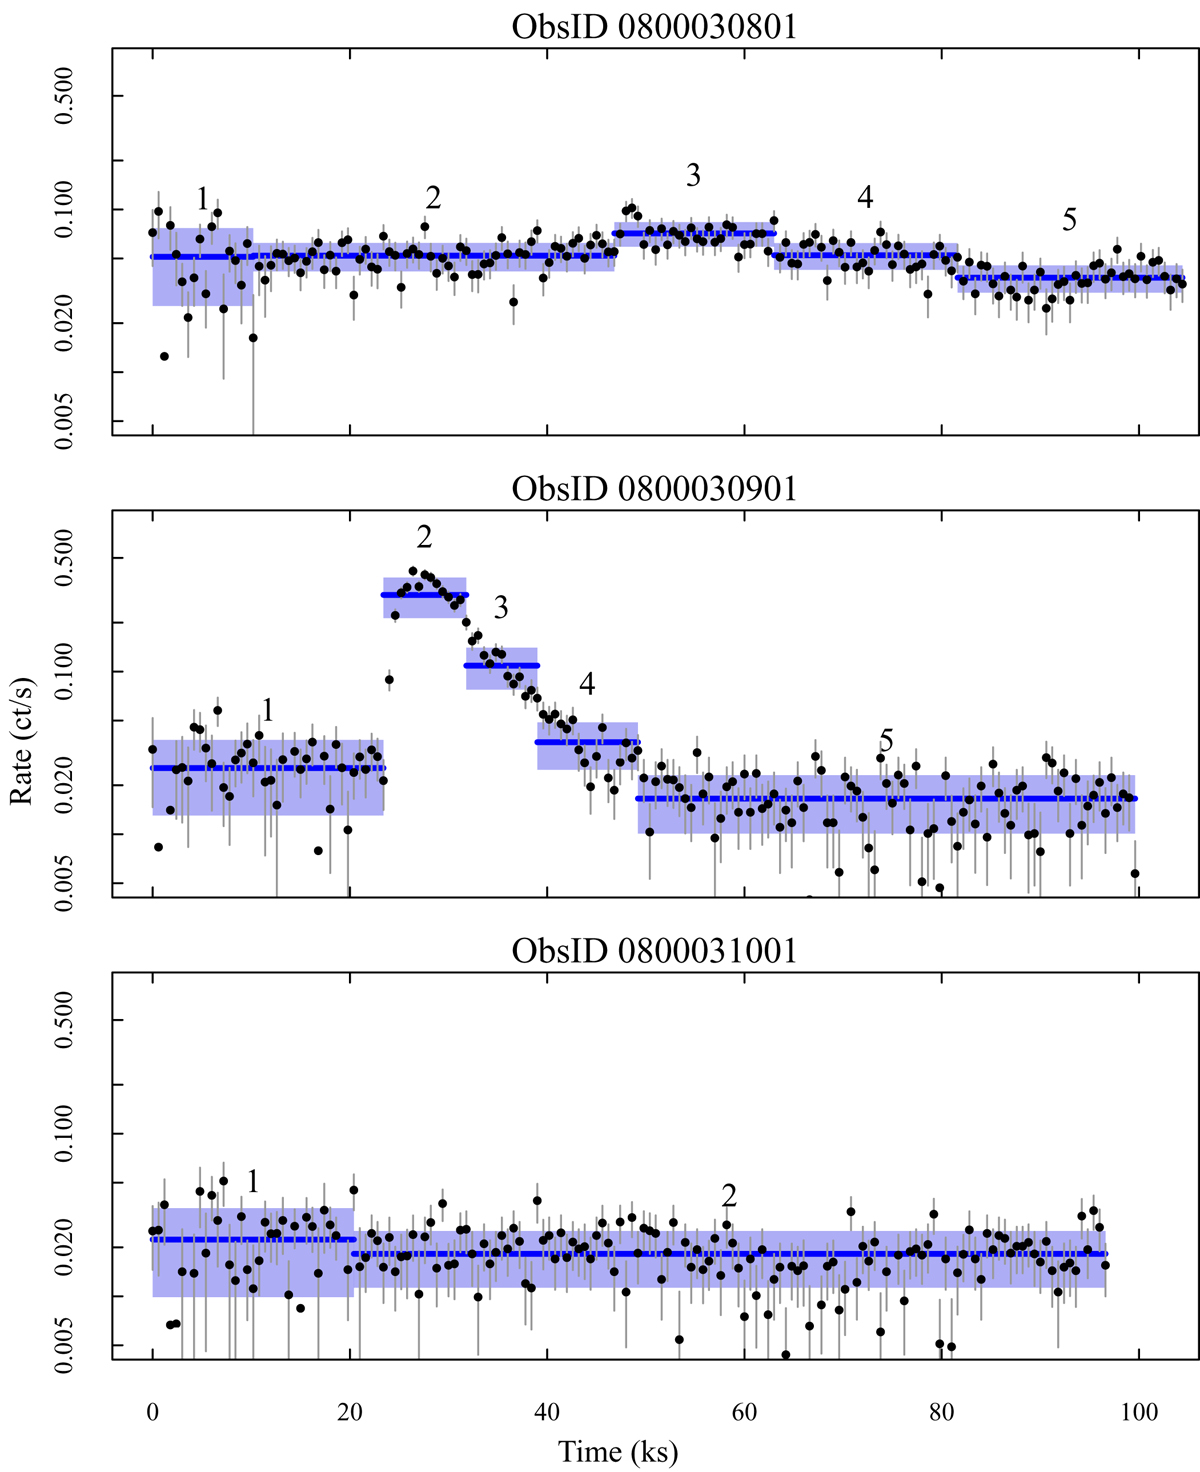
Analysis via PELT of the XMM-Newton PN light curves in the 0.3–8.0 keV bandpass subtracted of background rate. Bin size is 600 s and the rate is shown in a log scale. Panels have the same range on the y-axis. Horizontal segments and shaded areas indicate the average count rate and variance in each time interval (numbers on top of the intervals). The semi-log scale helps to recognize the regular exponential decay of the flare.
Current usage metrics show cumulative count of Article Views (full-text article views including HTML views, PDF and ePub downloads, according to the available data) and Abstracts Views on Vision4Press platform.
Data correspond to usage on the plateform after 2015. The current usage metrics is available 48-96 hours after online publication and is updated daily on week days.
Initial download of the metrics may take a while.