Fig. 3.
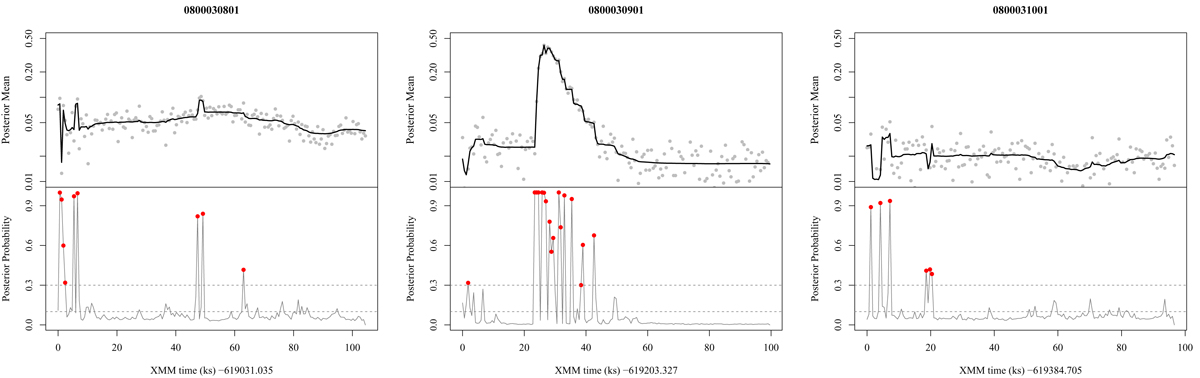
Analysis via BCP of the XMM-Newton PN light curves in the 0.3–8.0 keV bandpass. Top panel: light curve (gray dots) with the posterior mean (solid line). The scale of the y-axis is logarithmic and with the same range of values across the 3 panels for ease of comparison. Bottom panel: posterior probability at each point. We indicated the probabilities P > 0.3 with red dots; the horizontal dotted lines show the levels at significance P = 0.3 and P = 0.1, respectively.
Current usage metrics show cumulative count of Article Views (full-text article views including HTML views, PDF and ePub downloads, according to the available data) and Abstracts Views on Vision4Press platform.
Data correspond to usage on the plateform after 2015. The current usage metrics is available 48-96 hours after online publication and is updated daily on week days.
Initial download of the metrics may take a while.