Fig. 12.
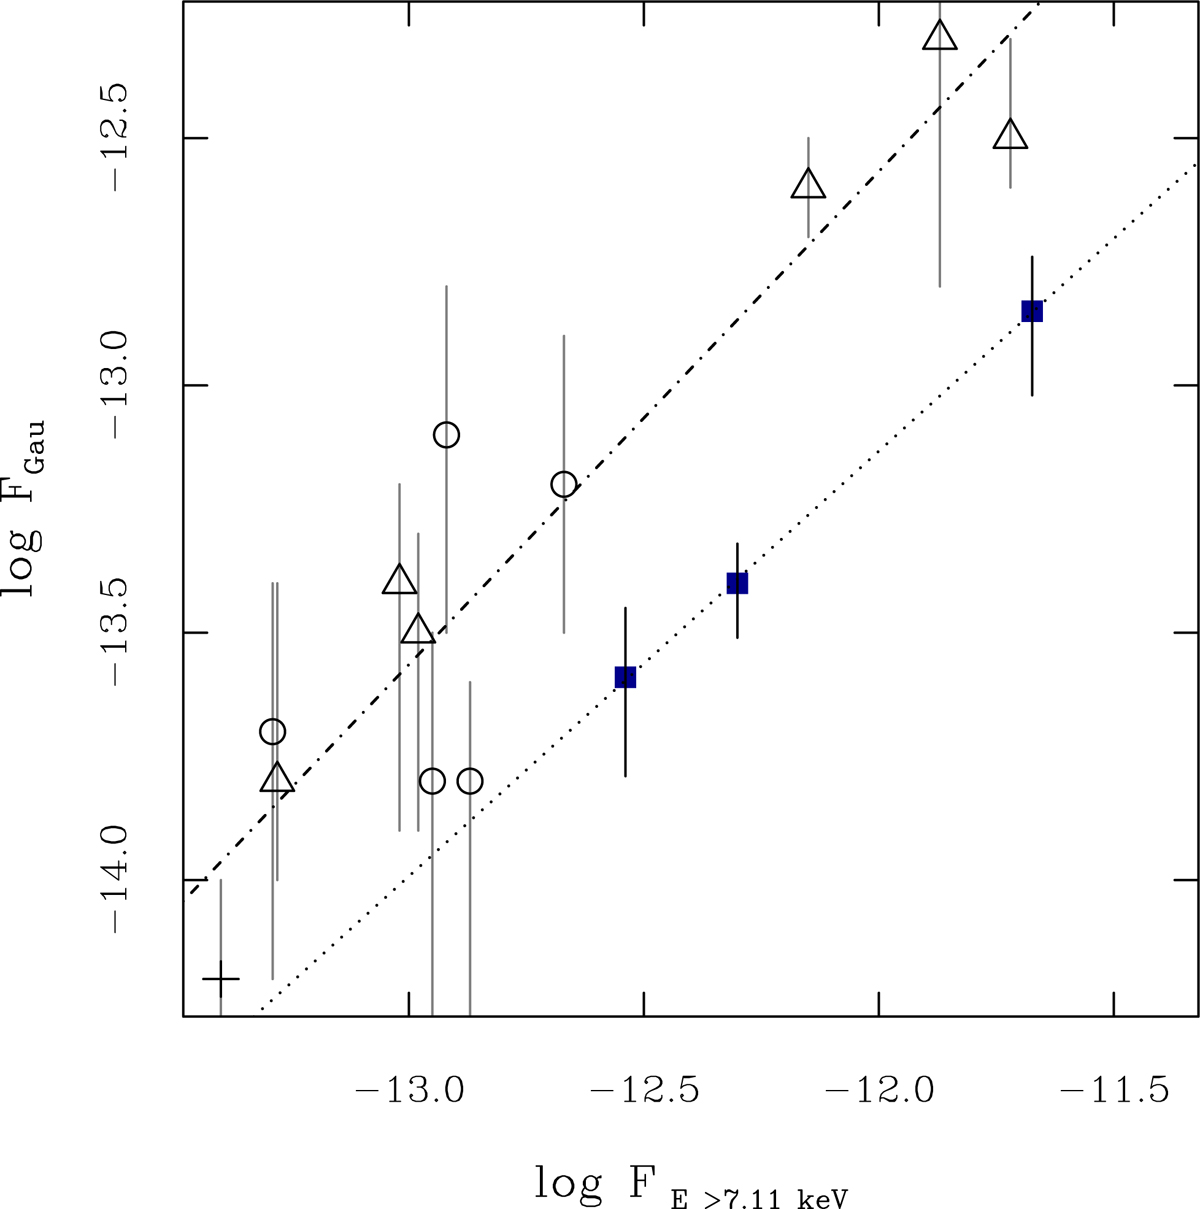
Flux of the Gaussian spectral component vs. the flux above 7.11 keV. The circles refer to the first XMM-Newton observation, the triangles refer to during the flare (triangles), and the cross indicates the last XMM-Newton observation. The filled symbols refer to the fluxes derived from NuSTAR best-fit models (see Table A.2). The lines are the linear best fit to the XMM-Newton and NuSTAR data, respectively.
Current usage metrics show cumulative count of Article Views (full-text article views including HTML views, PDF and ePub downloads, according to the available data) and Abstracts Views on Vision4Press platform.
Data correspond to usage on the plateform after 2015. The current usage metrics is available 48-96 hours after online publication and is updated daily on week days.
Initial download of the metrics may take a while.