Free Access
Fig. 10.
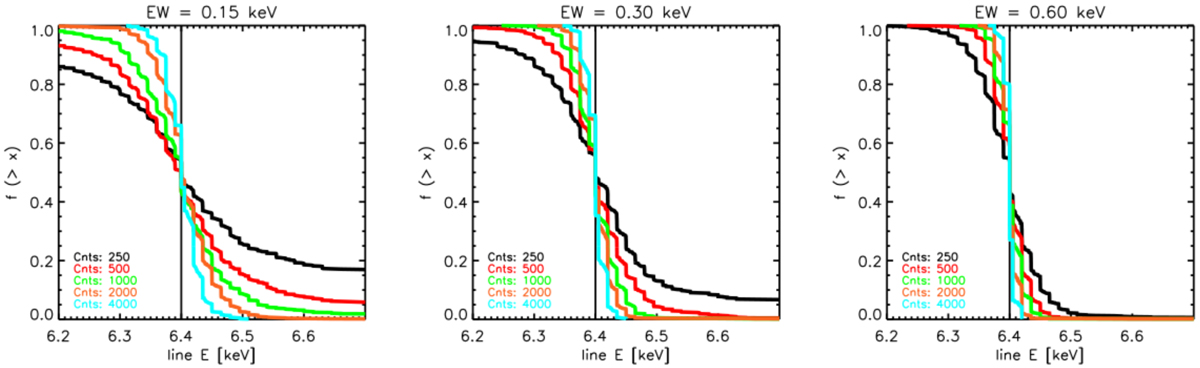
Cumulative distributions of the best-fit centroid positions of the Gaussian line from the simulations at various levels of count statistics (values in the plots) and for three values of the EW of the Gaussian line used in the starting model (indicated in the title of the plots).
Current usage metrics show cumulative count of Article Views (full-text article views including HTML views, PDF and ePub downloads, according to the available data) and Abstracts Views on Vision4Press platform.
Data correspond to usage on the plateform after 2015. The current usage metrics is available 48-96 hours after online publication and is updated daily on week days.
Initial download of the metrics may take a while.