Fig. 2.
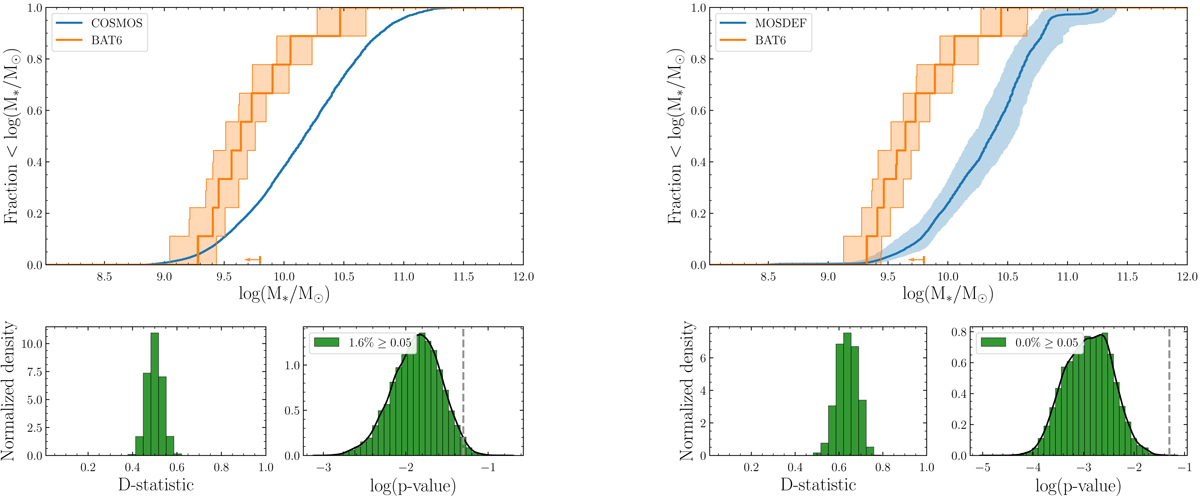
Top panels: cumulative stellar mass distribution for the hosts of the BAT6 sample (orange) and the star-forming galaxies from the COSMOS2015 Ultra Deep catalogue (blue, left panel) and MOSDEF (blue, right panel) at 1 < z < 2. The COSMOS2015 Ultra Deep and MOSDEF CDFs are weighted by SFR. Limits are indicated by arrows at the bottom of the plot. Bottom panels: normalised histogram of the maximum distance between the BAT6 and the survey CDFs for each Monte Carlo realisation and of the p-value from the two-sample K–S test computed for each Monte Carlo realisation. The black curve represents the Gaussian kernel density estimation. The vertical dashed line indicates a p-value of 0.05, above which it is no longer possible to reject the null hypothesis that the two samples are drawn from the same distribution at a 95% confidence level.
Current usage metrics show cumulative count of Article Views (full-text article views including HTML views, PDF and ePub downloads, according to the available data) and Abstracts Views on Vision4Press platform.
Data correspond to usage on the plateform after 2015. The current usage metrics is available 48-96 hours after online publication and is updated daily on week days.
Initial download of the metrics may take a while.