Fig. 10.
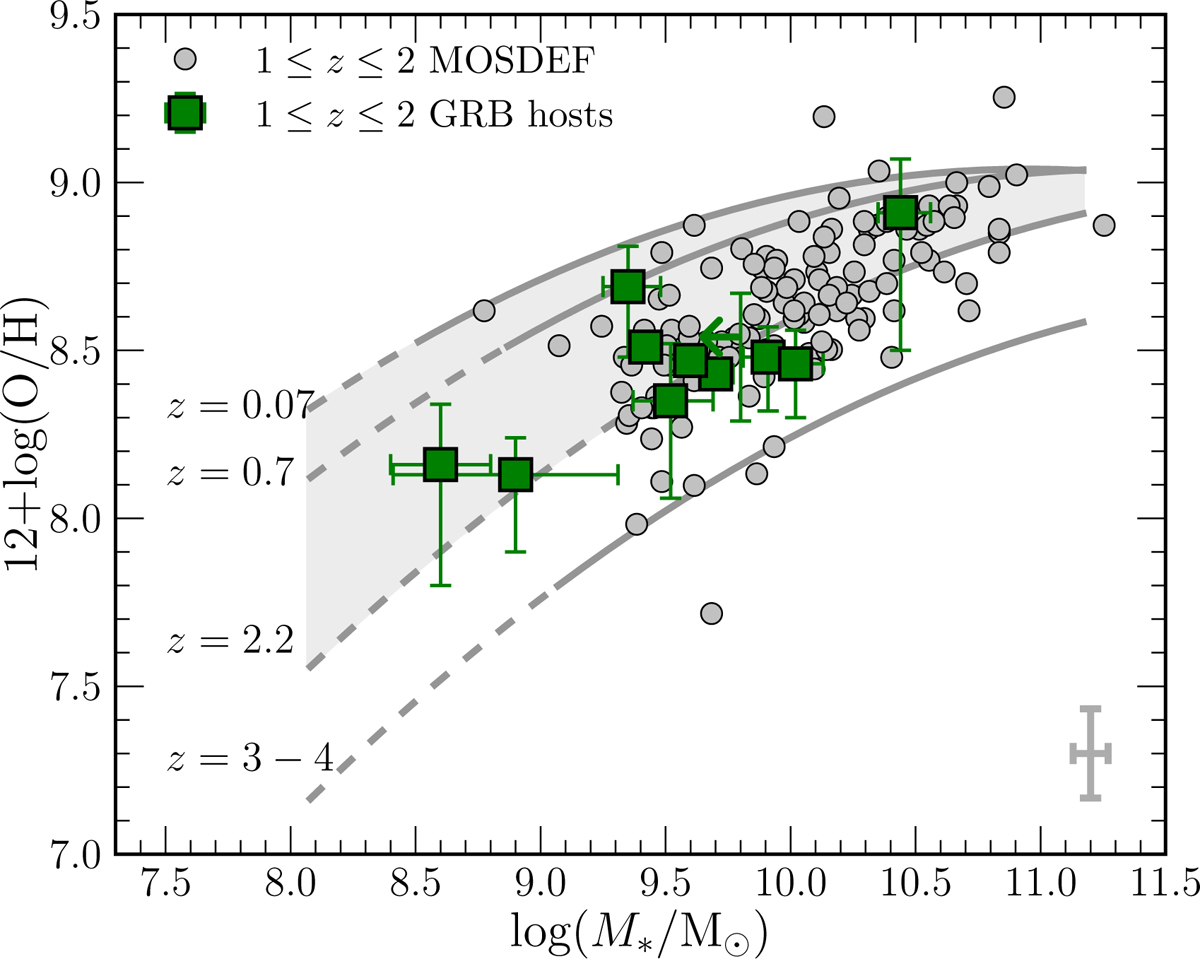
MZR in the M08 calibrator for the BAT6 sample at 1 < z < 2 (squares). The grey points are from the MOSDEF sample at 1 < z < 2, with their average uncertainty shown on the bottom right. The curves represent the MZR relation of Mannucci et al. (2009) from z = 0.07 to z ∼ 3.5, with the extrapolation below the mass completeness indicated in dashed.
Current usage metrics show cumulative count of Article Views (full-text article views including HTML views, PDF and ePub downloads, according to the available data) and Abstracts Views on Vision4Press platform.
Data correspond to usage on the plateform after 2015. The current usage metrics is available 48-96 hours after online publication and is updated daily on week days.
Initial download of the metrics may take a while.