Free Access
Fig. 9.
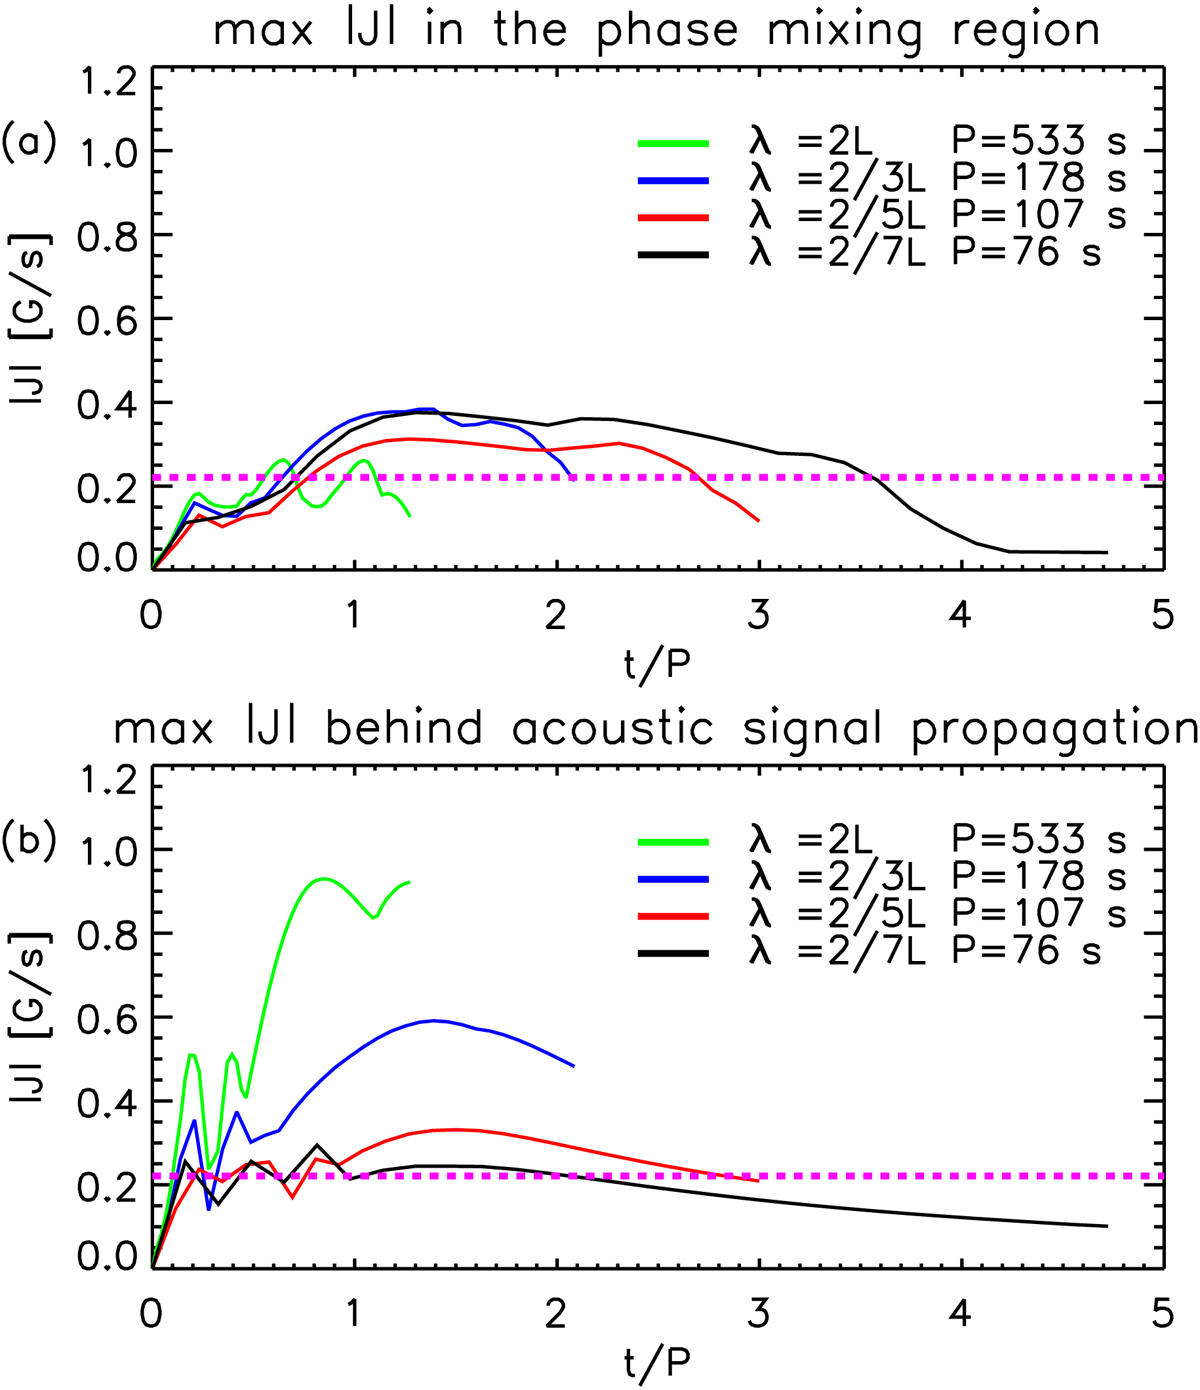
For the four simulations where P = 533 s, P = 178 s, P = 107 s, P = 76 s: the maximum electric current modulus as a function of time (normalised to the period of the Alfvén wave) in the region beyond the z coordinated reached by a sound wave at each time (panel a) and for the region below the same location (panel b).
Current usage metrics show cumulative count of Article Views (full-text article views including HTML views, PDF and ePub downloads, according to the available data) and Abstracts Views on Vision4Press platform.
Data correspond to usage on the plateform after 2015. The current usage metrics is available 48-96 hours after online publication and is updated daily on week days.
Initial download of the metrics may take a while.