Free Access
Fig. 20.
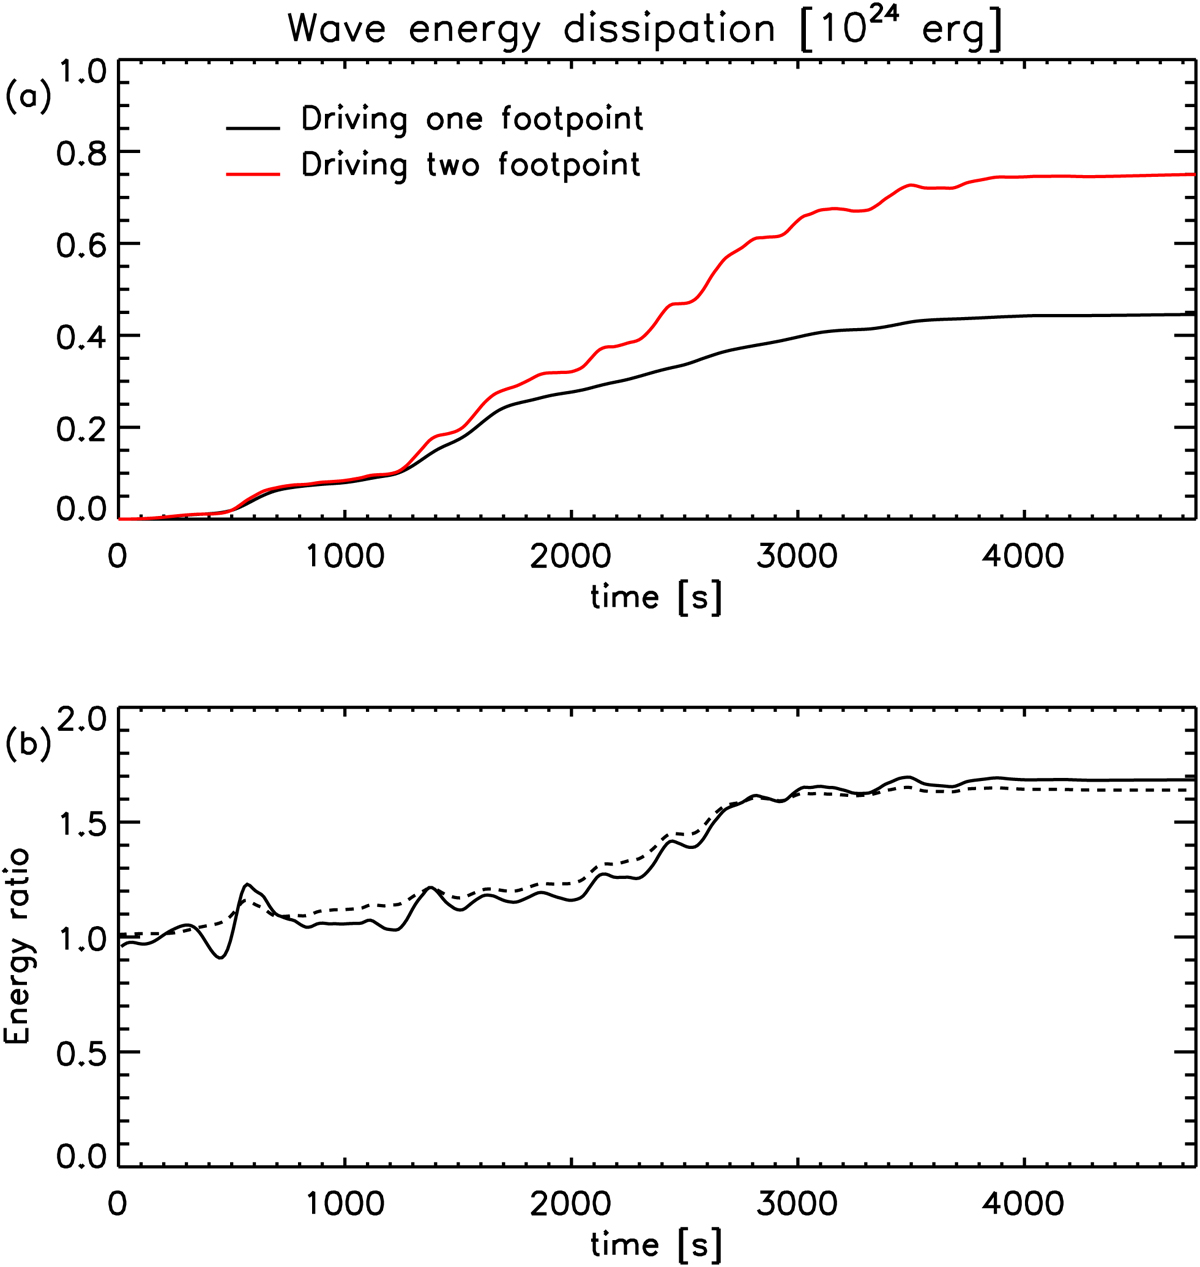
Panel a: wave energy dissipation in the two simulations where we drive either one or two footpoints. Panel b: ratio between the energy dissipation in the two simulations (continuous line) and between the energy of driver in the two simulations (dashed line).
Current usage metrics show cumulative count of Article Views (full-text article views including HTML views, PDF and ePub downloads, according to the available data) and Abstracts Views on Vision4Press platform.
Data correspond to usage on the plateform after 2015. The current usage metrics is available 48-96 hours after online publication and is updated daily on week days.
Initial download of the metrics may take a while.