Fig. 15.
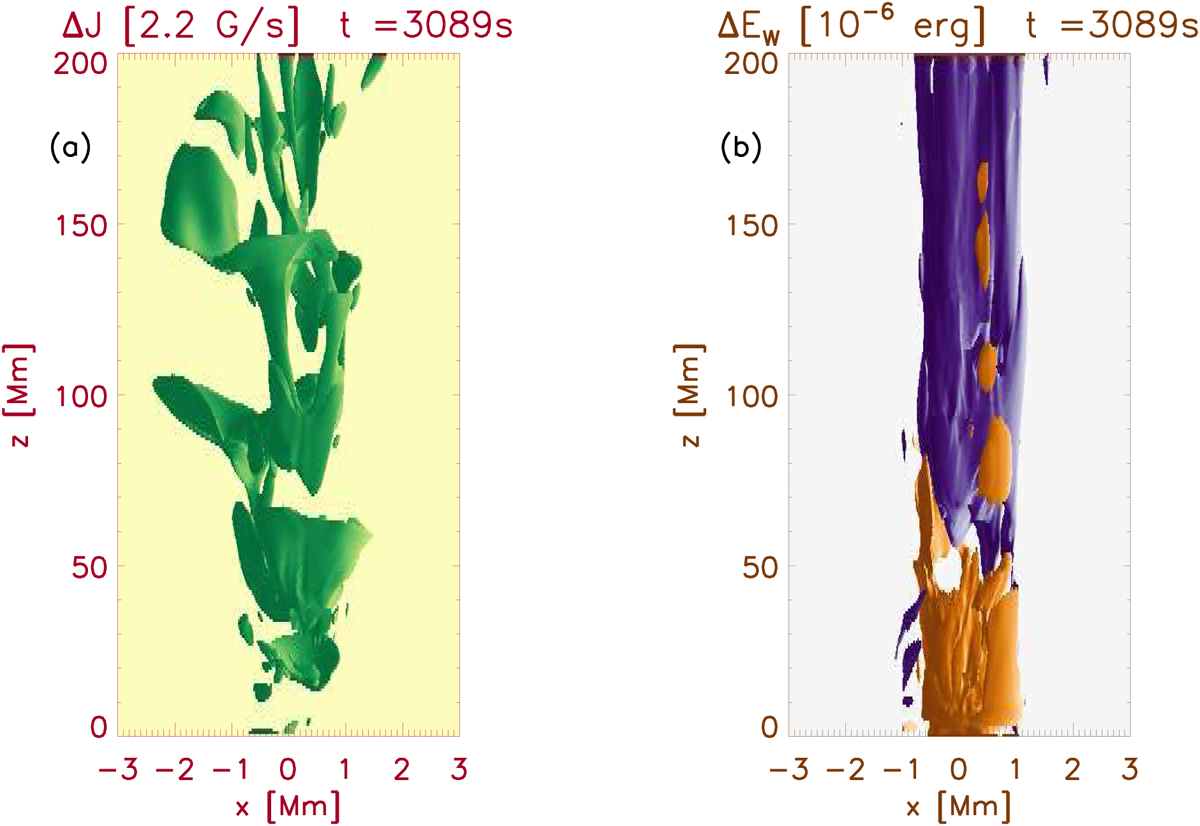
3D contours of the differences between the simulations with η = 0 and η = 1010ηS. Panel a: electric current difference that shows where the simulation without resistivity has stronger currents. The differences contour is 10j0. Panel b: wave energy difference, where violet contours shows where the wave energy has been dissipated in the simulation with resistivity and yellow contours shows where it occurs that the simulation with resistivity presents more wave energy. The temporal evolution is available in a movie online.
Current usage metrics show cumulative count of Article Views (full-text article views including HTML views, PDF and ePub downloads, according to the available data) and Abstracts Views on Vision4Press platform.
Data correspond to usage on the plateform after 2015. The current usage metrics is available 48-96 hours after online publication and is updated daily on week days.
Initial download of the metrics may take a while.