Free Access
Fig. 14.
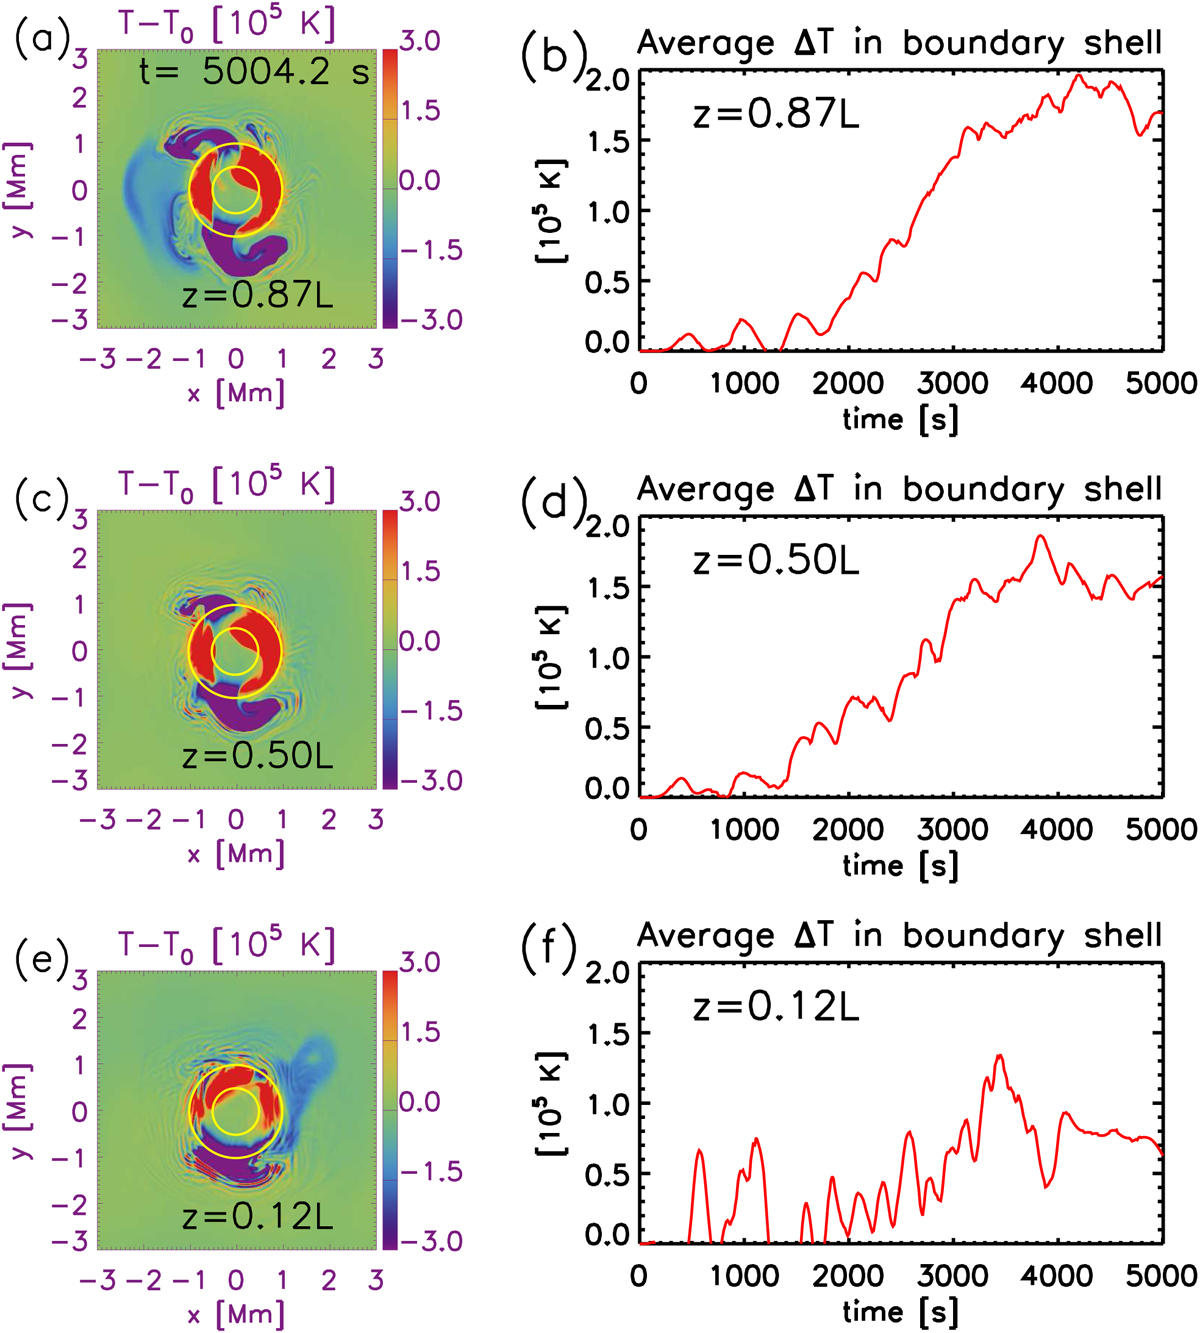
Panels a,c, and e: maps of the temperature variation over the simulation at three cross sections near footpoint, at centre and near the end of the loop. Panels b,d, and f: time evolution of the temperature variation on the boundary shell averaged over the density at the cross sections shown in the left hand side column.
Current usage metrics show cumulative count of Article Views (full-text article views including HTML views, PDF and ePub downloads, according to the available data) and Abstracts Views on Vision4Press platform.
Data correspond to usage on the plateform after 2015. The current usage metrics is available 48-96 hours after online publication and is updated daily on week days.
Initial download of the metrics may take a while.