Fig. 13.
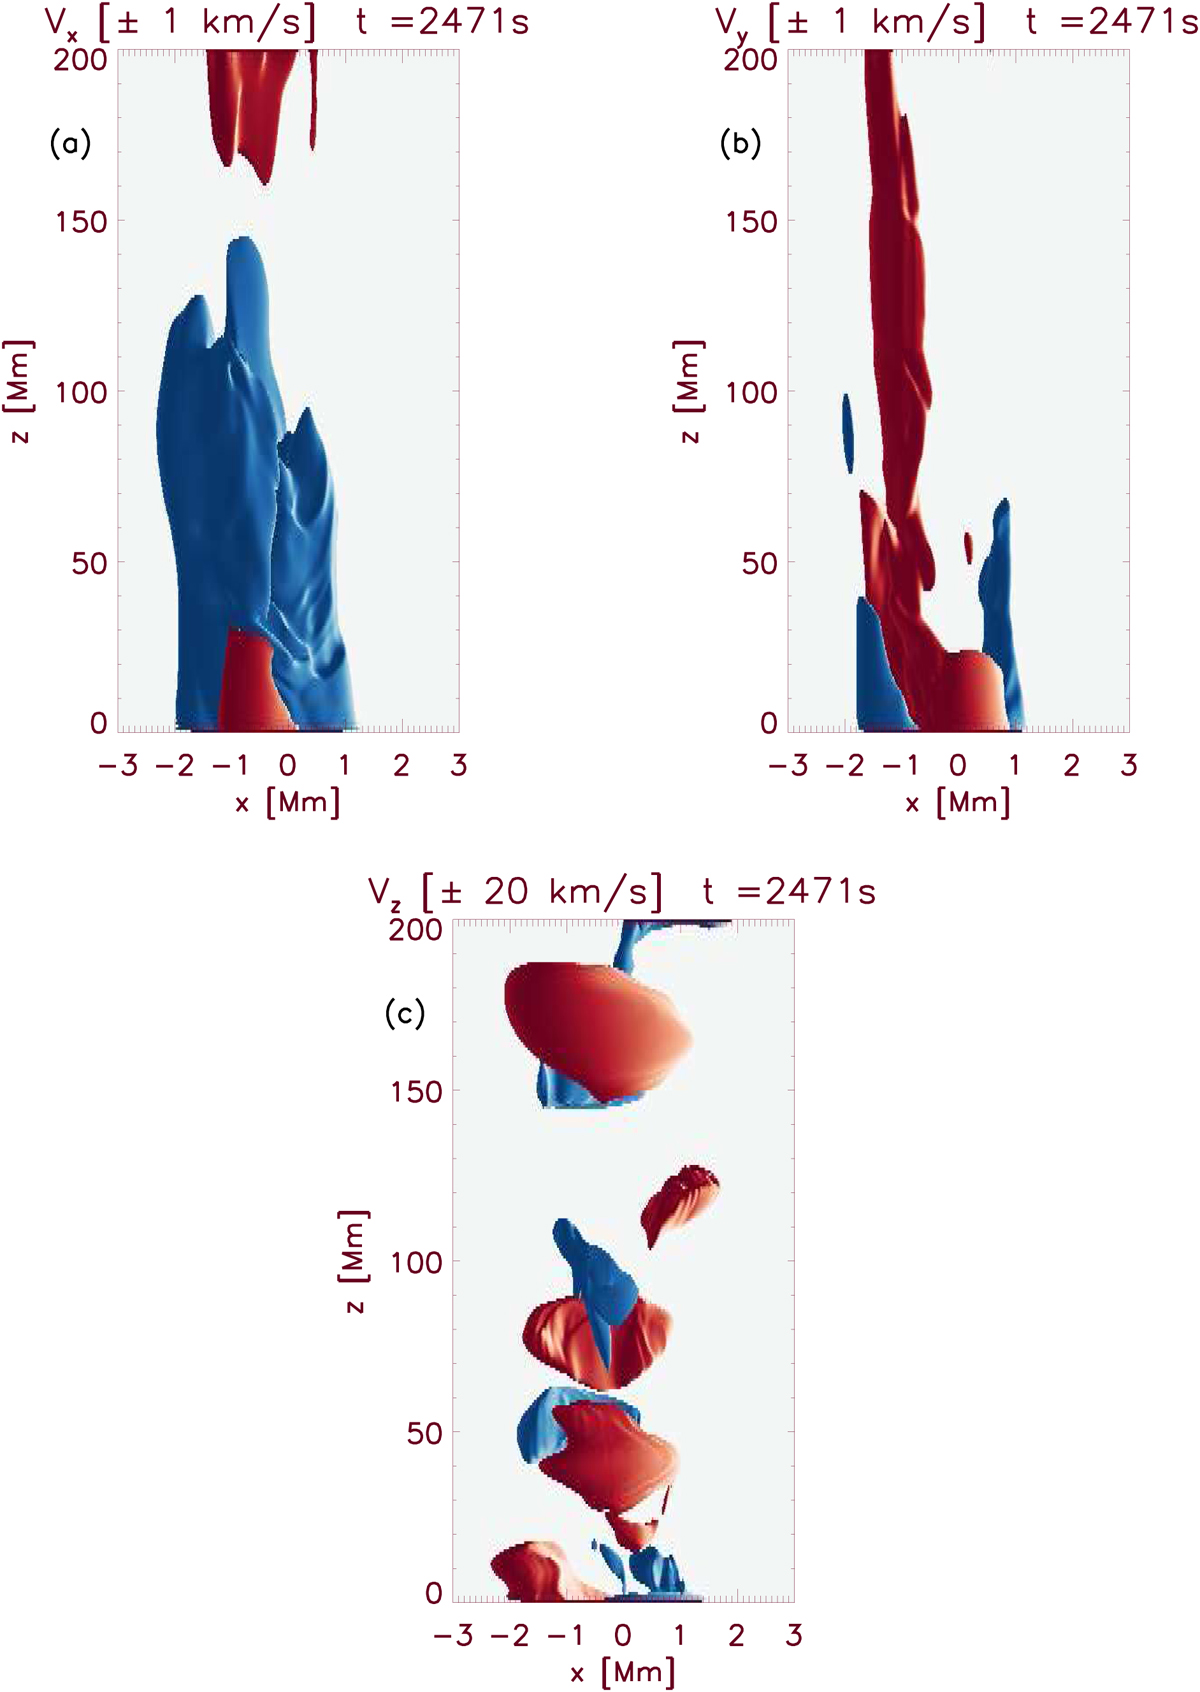
3D contours of the velocity components at t = 2471 s. We show contours where the absolute value of the velocity components are 1 km s−1 for Vx (panel a) and Vy (panel b) and 20 km s−1 for Vz (panel c) and we identify negative velocities with red contours and positive ones with blue contours. The temporal evolution is available in a movie online.
Current usage metrics show cumulative count of Article Views (full-text article views including HTML views, PDF and ePub downloads, according to the available data) and Abstracts Views on Vision4Press platform.
Data correspond to usage on the plateform after 2015. The current usage metrics is available 48-96 hours after online publication and is updated daily on week days.
Initial download of the metrics may take a while.