Fig. 1.
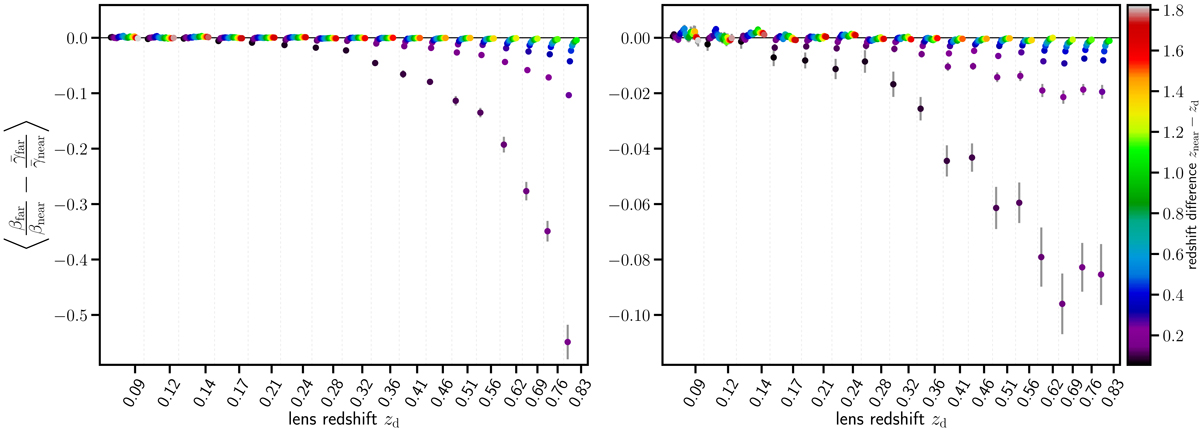
Shear-ratio test of two populations of galaxies that are sheared by the same lens, i.e. zfar > znear > zd with source redshifts in consecutive bins. The dotted lines separate shear-ratios from different lens galaxies, while source redshifts increase from left to right which is highlighted by color code. Each color represents a combination of two sources at znear and zfar. Ideally the outcome of the SRT (12) is zero. Data is taken from ray-tracing through the Millennium simulation. The shear estimator ![]() is defined in Eq. (11) with
is defined in Eq. (11) with ![]() and θout = 5′. Errors are obtained by a Jackknife method from the 64 different realizations per redshift. Left panel: all simulated galaxies have been used. Right panel: a magnitude cut of 24 mag in the r-band is applied for the lens galaxies.
and θout = 5′. Errors are obtained by a Jackknife method from the 64 different realizations per redshift. Left panel: all simulated galaxies have been used. Right panel: a magnitude cut of 24 mag in the r-band is applied for the lens galaxies.
Current usage metrics show cumulative count of Article Views (full-text article views including HTML views, PDF and ePub downloads, according to the available data) and Abstracts Views on Vision4Press platform.
Data correspond to usage on the plateform after 2015. The current usage metrics is available 48-96 hours after online publication and is updated daily on week days.
Initial download of the metrics may take a while.