Fig. 7.
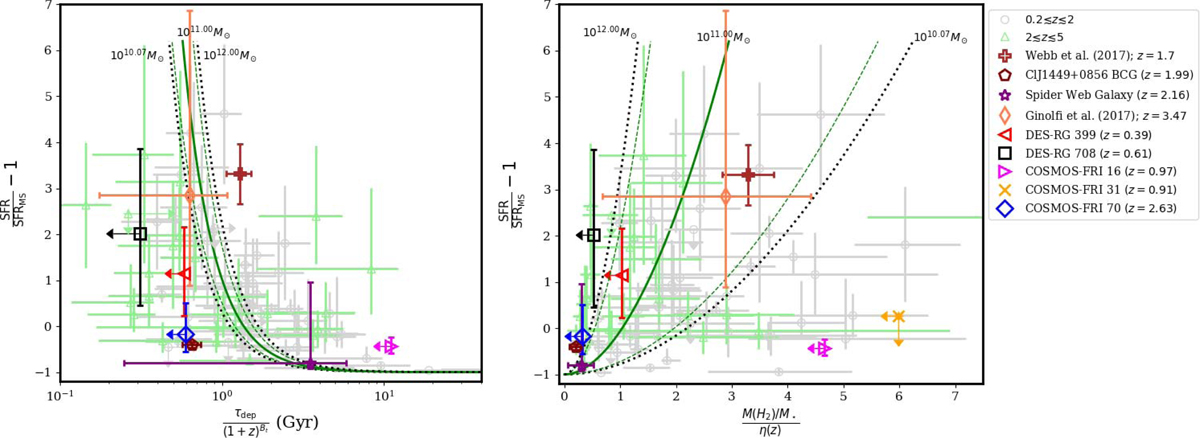
Fractional offset from the star-forming MS as a function of the molecular gas depletion timescale (left panel) and molecular-gas-to-stellar-mass ratio (right panel); (proto-)cluster galaxies at 0.2 ≲ z ≲ 5 detected in CO are shown. In both panels the solid green curve shows the scaling relation for field galaxies found by Tacconi et al. (2018) for galaxies with log(M⋆/M⊙) = 11 and an effective radius equal to the mean value found by van der Wel et al. (2014) for star forming galaxies for given z and M⋆. The green dashed lines show the statistical 1σ uncertainties in the model. The dotted black lines are the same scaling relation as the solid green lines, but for different stellar masses log(M/M⋆) = 10.07 and 12, that represent the stellar mass range associated with the data points.
Current usage metrics show cumulative count of Article Views (full-text article views including HTML views, PDF and ePub downloads, according to the available data) and Abstracts Views on Vision4Press platform.
Data correspond to usage on the plateform after 2015. The current usage metrics is available 48-96 hours after online publication and is updated daily on week days.
Initial download of the metrics may take a while.