Fig. 6.
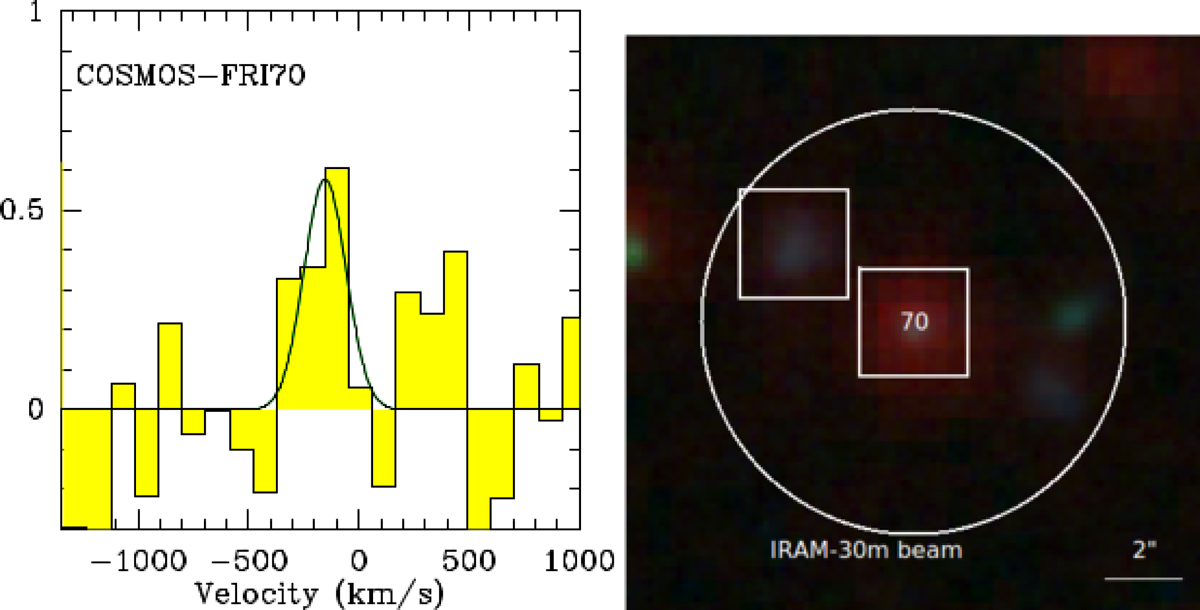
Left panel: baseline-subtracted spectrum of COSMOS-FRI 70 obtained with the IRAM-30 m. The solid curve shows the Gaussian fit to the CO(7→6) emission line. In the y-axis we show Tmb in units of millikelvin. Right panel: RGB image centered at the coordinates of COSMOS-FRI 70 and obtained using Spitzer 3.6 μm (Sanders et al. 2007), Subaru r-, and Subaru B-band images (Taniguchi et al. 2007) for the R, G, and B channels, respectively. The two squares denote the locations of COSMOS-FRI 70 and its northern companion with ![]() from the Laigle et al. (2016) catalog. The white circle shows the IRAM-30 m beam. North is up.
from the Laigle et al. (2016) catalog. The white circle shows the IRAM-30 m beam. North is up.
Current usage metrics show cumulative count of Article Views (full-text article views including HTML views, PDF and ePub downloads, according to the available data) and Abstracts Views on Vision4Press platform.
Data correspond to usage on the plateform after 2015. The current usage metrics is available 48-96 hours after online publication and is updated daily on week days.
Initial download of the metrics may take a while.