Fig. 4.
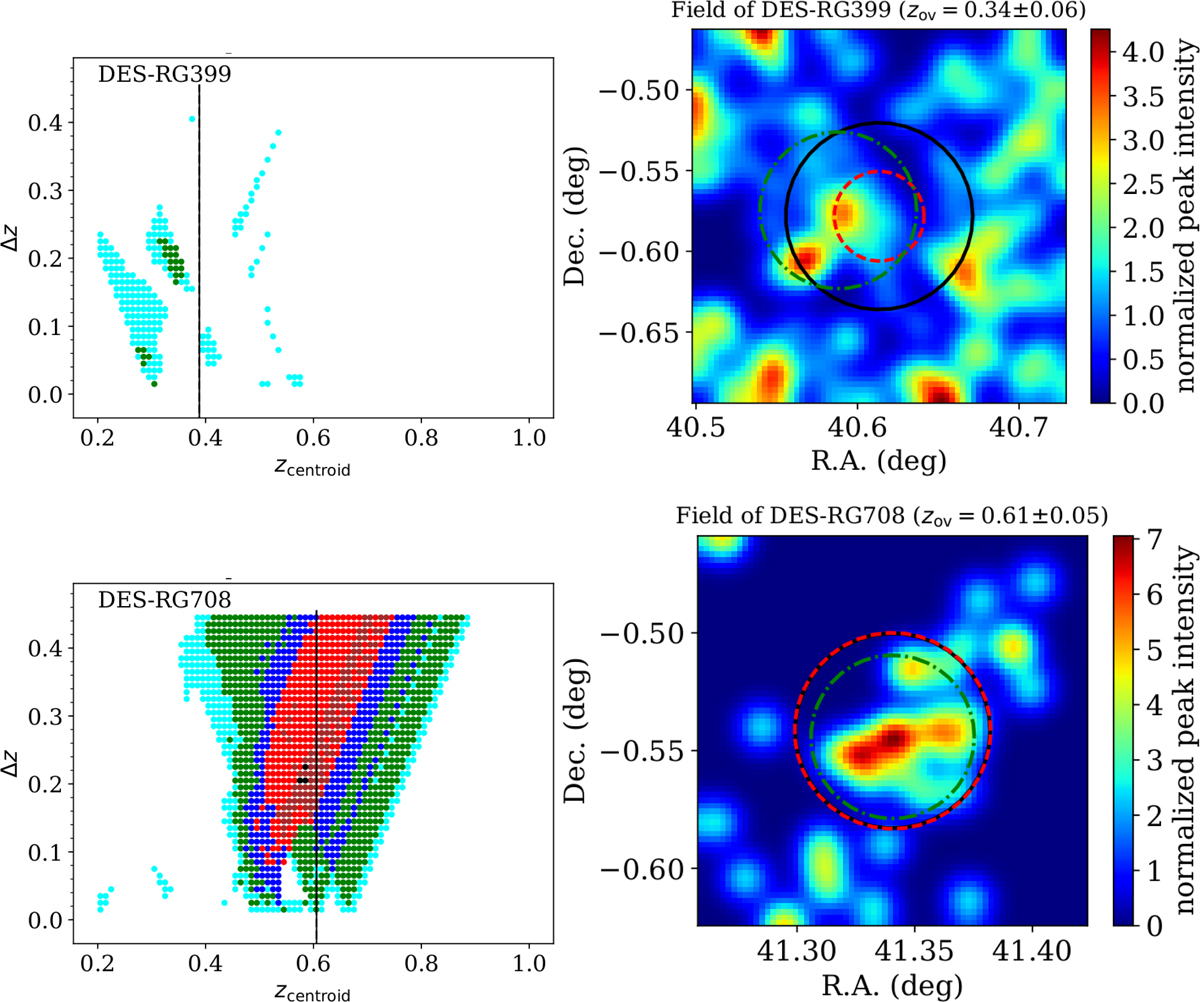
Left panel: PPM plots for DES-RG 399 and 708. In each plot the vertical solid line shows the spectroscopic redshift of each radio source. Colored dots refer to significance levels >2σ (cyan), 3σ (green), 4σ (blue), 5σ (red), 6σ (brown), and 7σ (black). Right panel: Gaussian density maps centered at the projected space coordinates of the radio galaxies. The pixel size is 1/16 Mpc while the Gaussian kernel has σ = 3/16 Mpc. Sources with SDSS photometric redshifts between ![]() and
and ![]() were considered to produce the maps, where zov and
were considered to produce the maps, where zov and ![]() are reported in Table 7, for each overdensity. The solid black and dashed red circles are centered at the projected space coordinates of the radio source. The former has a (physical) radius of 1 Mpc, estimated at zov, while the latter, with a radius ℛPPM, denotes the region within which the PPM detects the overdensity. The dotted-dashed green circle is centered at the peak of the detection as found by the wavelet transform and has a radius ℛw.
are reported in Table 7, for each overdensity. The solid black and dashed red circles are centered at the projected space coordinates of the radio source. The former has a (physical) radius of 1 Mpc, estimated at zov, while the latter, with a radius ℛPPM, denotes the region within which the PPM detects the overdensity. The dotted-dashed green circle is centered at the peak of the detection as found by the wavelet transform and has a radius ℛw.
Current usage metrics show cumulative count of Article Views (full-text article views including HTML views, PDF and ePub downloads, according to the available data) and Abstracts Views on Vision4Press platform.
Data correspond to usage on the plateform after 2015. The current usage metrics is available 48-96 hours after online publication and is updated daily on week days.
Initial download of the metrics may take a while.