Fig. 1
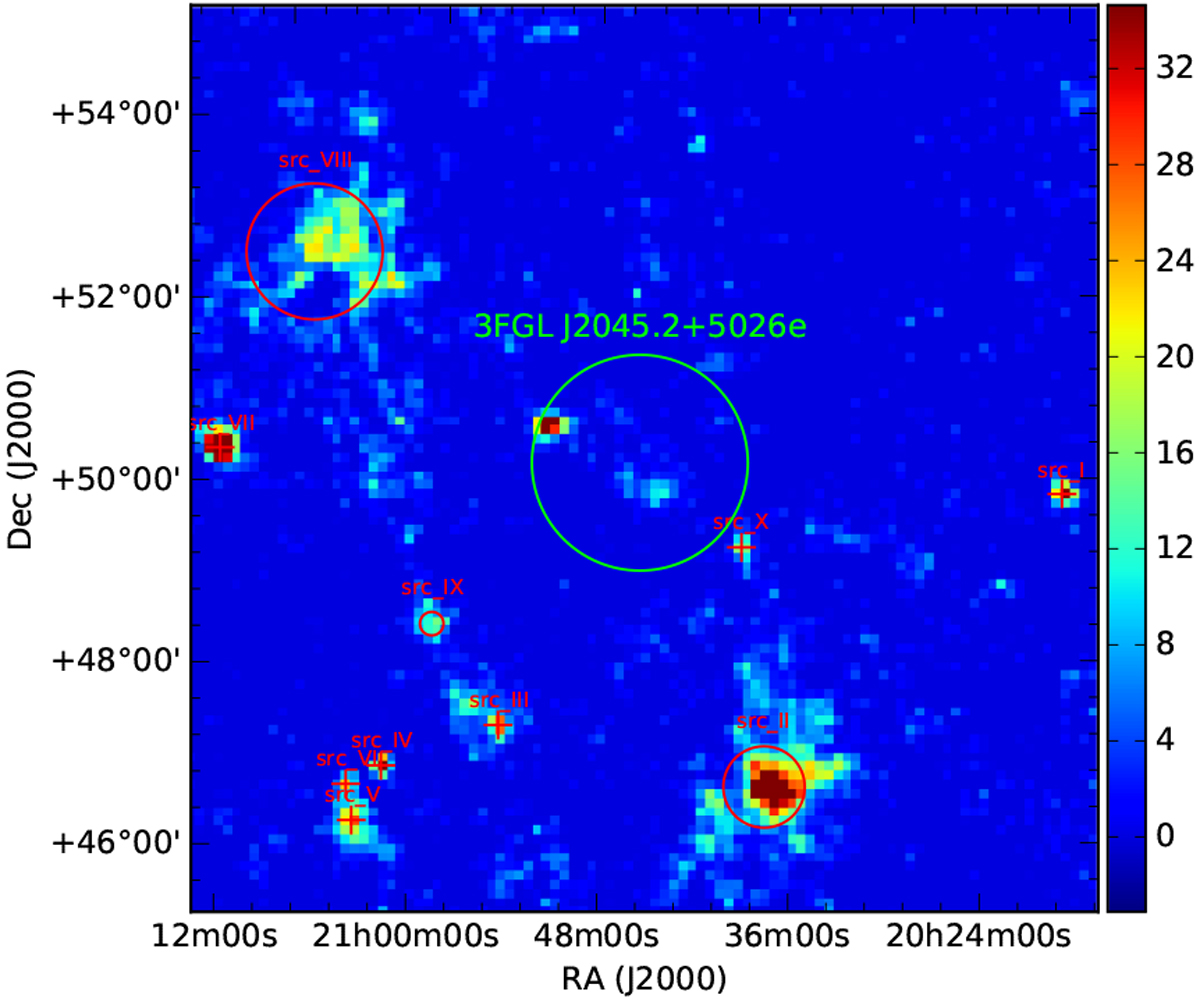
Test statistic map of the selected ROI with the new gamma-ray excesses found and modeled within this analysis. Red crosses indicate point-like sources, while red circles quantify the estimated extensions of the excesses (see Table 1). The position and the extension of the SNR HB 21 as defined in the 3FGL catalog is shown in green.
Current usage metrics show cumulative count of Article Views (full-text article views including HTML views, PDF and ePub downloads, according to the available data) and Abstracts Views on Vision4Press platform.
Data correspond to usage on the plateform after 2015. The current usage metrics is available 48-96 hours after online publication and is updated daily on week days.
Initial download of the metrics may take a while.