Fig. 3
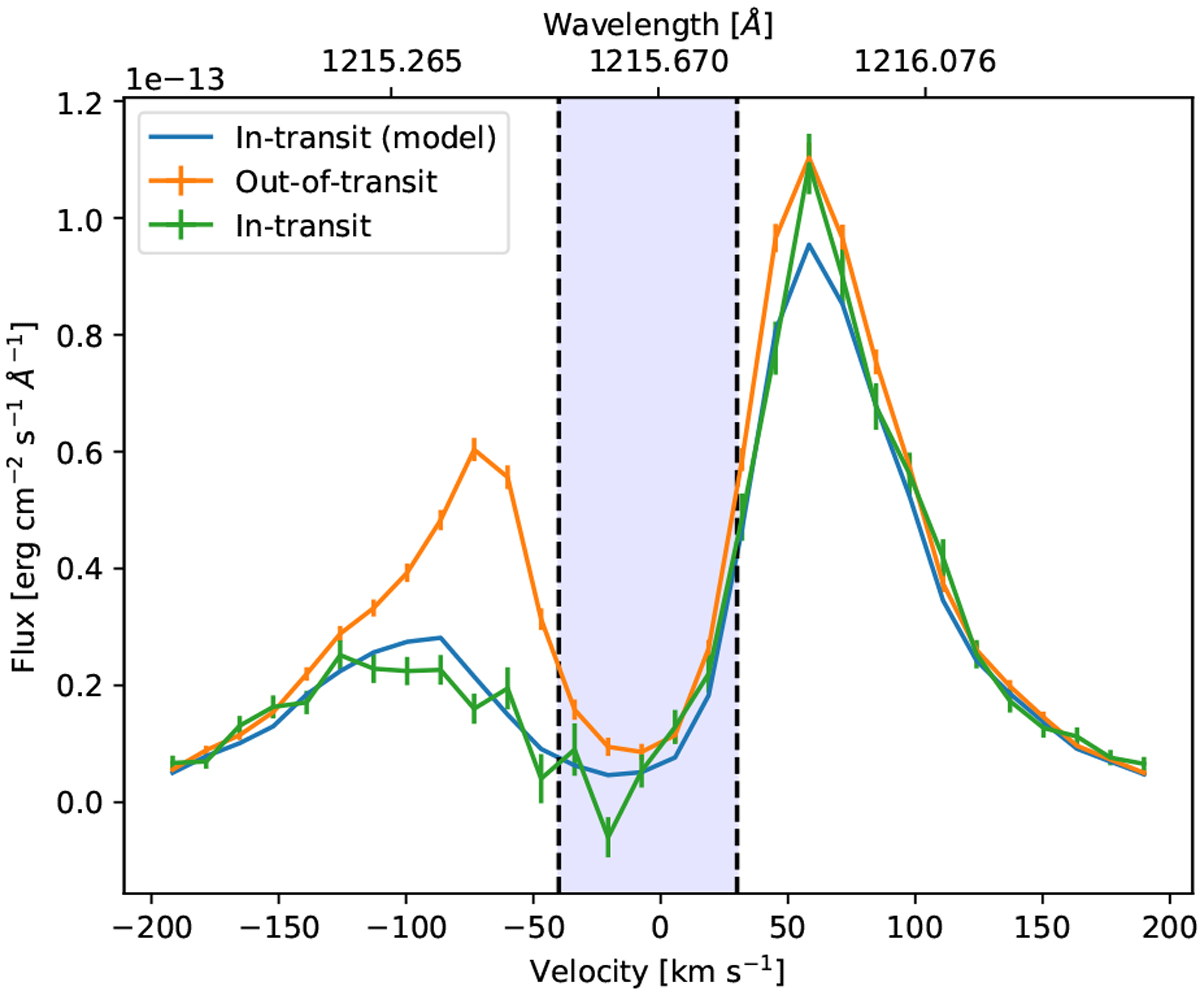
Modeled and observed mid-transit L-yα absorption of GJ 436b. We have used the in-transit data by Lavie et al. (2017) for out-of-transit and mid-transit observations. The core of the Ly-α line has been excluded, because it has been contaminated by geocoronal emission and thus cannot be observed. The contaminated region is marked by the dashed vertical lines and the blue shading. The green and orange lines show the mis-transit and out-of-transit observations (Lavie et al. 2017, Fig. 3). The blue line shows the modeled in-transit absorption.
Current usage metrics show cumulative count of Article Views (full-text article views including HTML views, PDF and ePub downloads, according to the available data) and Abstracts Views on Vision4Press platform.
Data correspond to usage on the plateform after 2015. The current usage metrics is available 48-96 hours after online publication and is updated daily on week days.
Initial download of the metrics may take a while.