Fig. 10
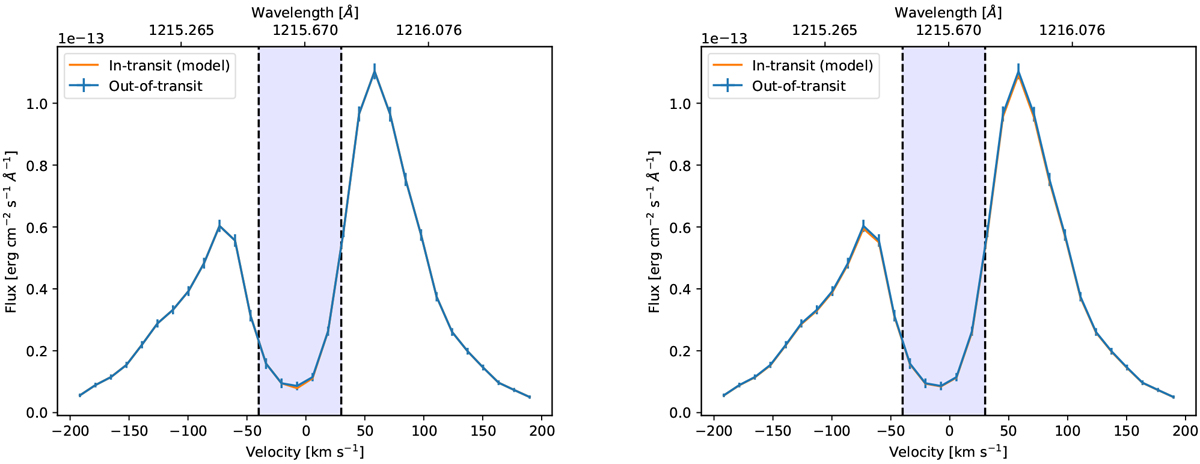
Modeled absorption for a nitrogen-dominated atmosphere at 3 XUV with a terrestrial hydrogen fraction (left panel) and a nitrogen-dominated atmosphere at 20 XUV (right panel). Modeled absorption is compared to the out-of-transit observation of GJ 436 (Lavie et al. 2017). The blue line shows the observed out-of-transit Ly-α profile of GJ 436. The orange line shows the modeled in-transit absorption. The region of the contamination by the geocoronal emission in the center of the line is marked by two vertical dashed lines. The observational errors are shown as errorbars of the blue line. One can see that in both cases the nitrogen-dominated atmospheres do not produce a significant in-transit Ly-α signature, which is indicated by the fact that the orange line practically coincides with the blue line.
Current usage metrics show cumulative count of Article Views (full-text article views including HTML views, PDF and ePub downloads, according to the available data) and Abstracts Views on Vision4Press platform.
Data correspond to usage on the plateform after 2015. The current usage metrics is available 48-96 hours after online publication and is updated daily on week days.
Initial download of the metrics may take a while.