Fig. 7.
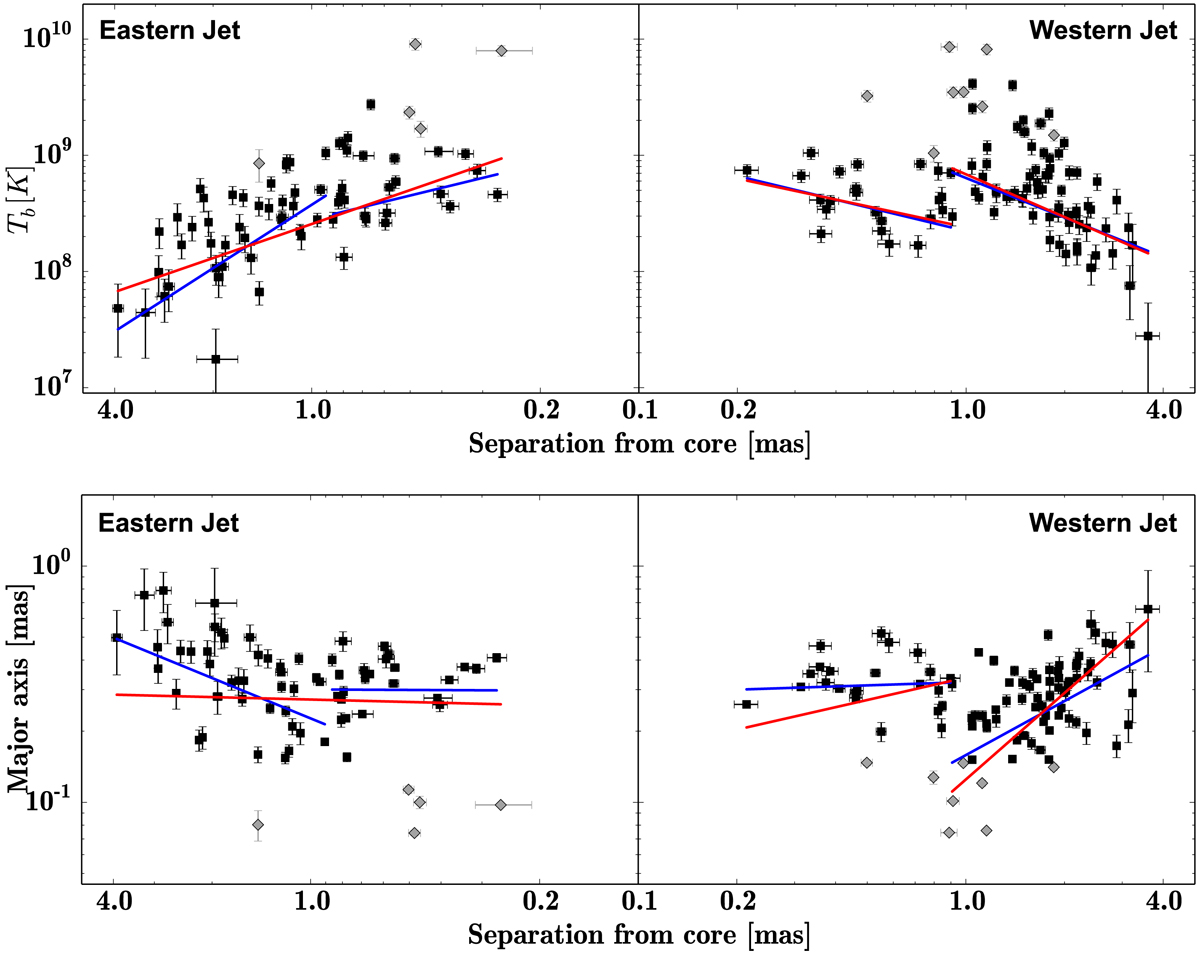
Brightness temperature (top panel) and component major axis (bottom panel) as functions of the core distance for both jets. Power laws are fitted (Tb ∝ rs ; D ∝ rd) and the indices are printed in Table 5. Two cases are distinguished: including all data points (red lines) and excluding the gray diamonds, corresponding to circular Gaussian fits whose major axes are smaller than 0.15 mas in size (blue lines). These data points do not seem to be a good representation of the width of the jets, but rather maybe owing to substructures within the jets.
Current usage metrics show cumulative count of Article Views (full-text article views including HTML views, PDF and ePub downloads, according to the available data) and Abstracts Views on Vision4Press platform.
Data correspond to usage on the plateform after 2015. The current usage metrics is available 48-96 hours after online publication and is updated daily on week days.
Initial download of the metrics may take a while.