Free Access
Fig. 6.
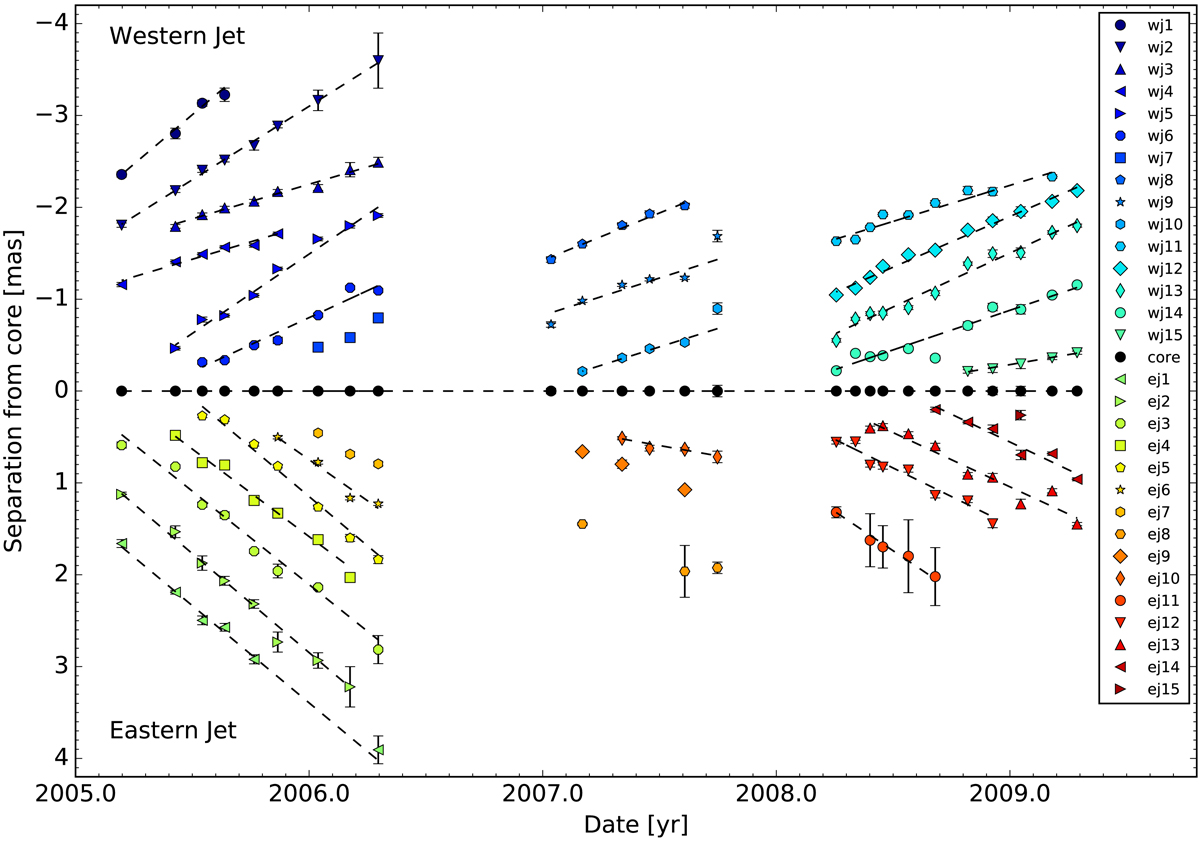
Core separation of individual Gaussian model-fit components over time. The fit to a linear function for each component is indicated by a dashed line (corresponding slopes are listed in Table 4). The eastern jet is plotted in the lower half of the plot, the western jet in the top half of the plot.
Current usage metrics show cumulative count of Article Views (full-text article views including HTML views, PDF and ePub downloads, according to the available data) and Abstracts Views on Vision4Press platform.
Data correspond to usage on the plateform after 2015. The current usage metrics is available 48-96 hours after online publication and is updated daily on week days.
Initial download of the metrics may take a while.