Fig. 3.
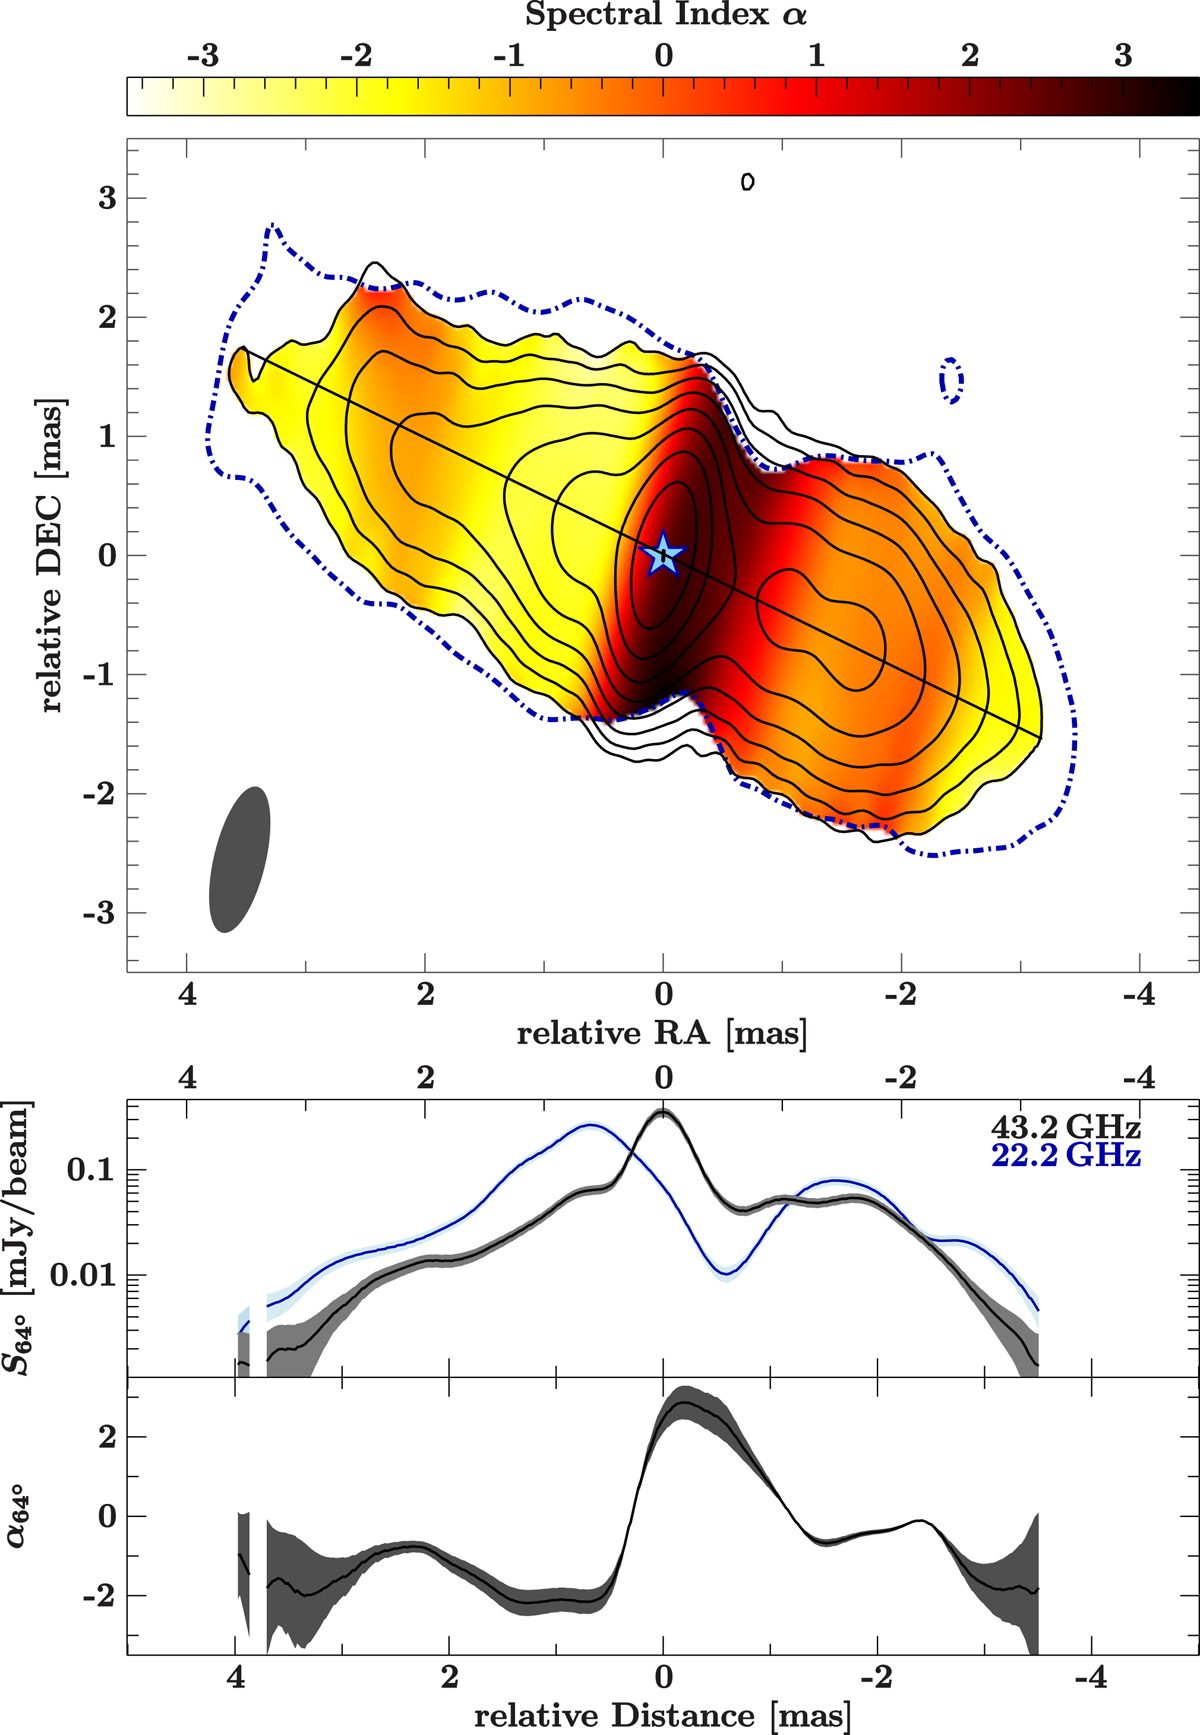
Stacked spectral index map (S ∝ ν+α) combining 19 22 GHz (blue dash-dotted contour) and 43 GHz (black contours) images between 2005 and 2009. A cut along the direction of the jets is shown in the lower panels, depicting the flux density profile and spectral index along the jet axis (see line in top panel). The blue star indicates the assumed location of the dynamical center. The contours of the 43 GHz map start at 5 times the noise level and increase logarithmically by factors of 2. For the 22 GHz map only one countour at 5 times the noise level is shown.
Current usage metrics show cumulative count of Article Views (full-text article views including HTML views, PDF and ePub downloads, according to the available data) and Abstracts Views on Vision4Press platform.
Data correspond to usage on the plateform after 2015. The current usage metrics is available 48-96 hours after online publication and is updated daily on week days.
Initial download of the metrics may take a while.