Fig. 2.
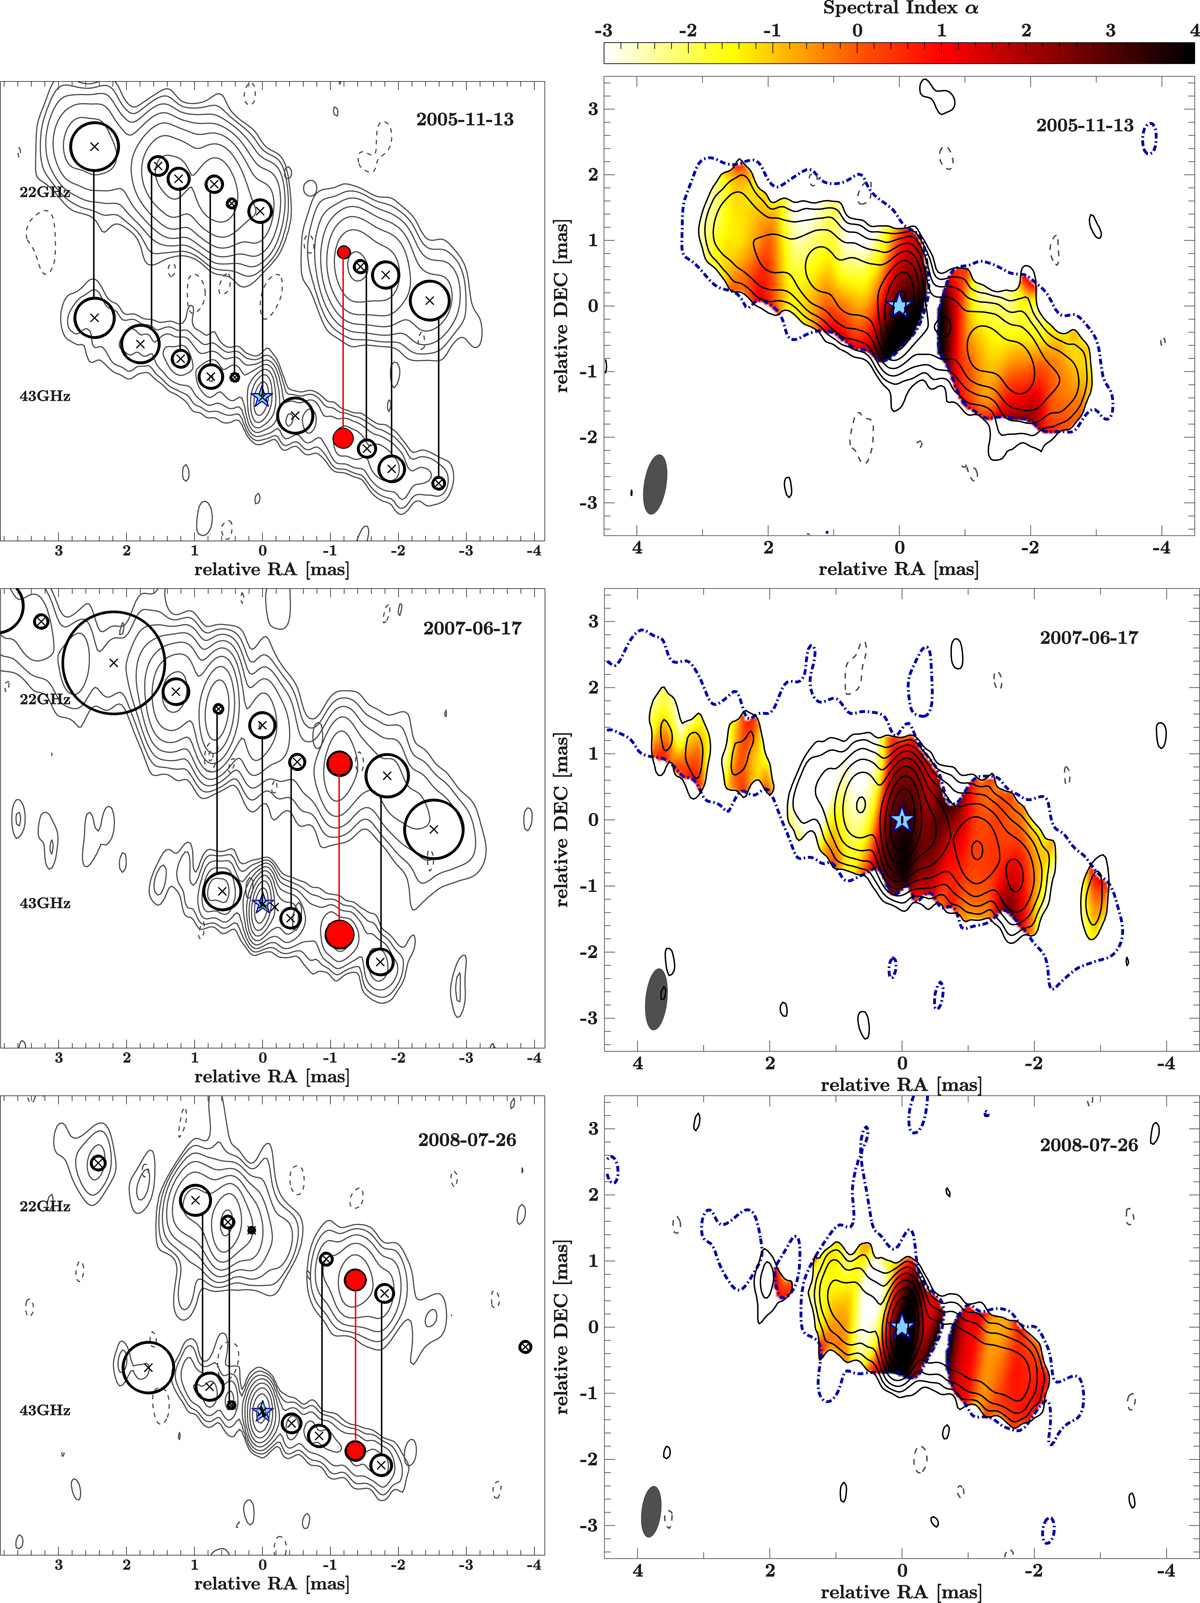
Left panels: three examples of the alignment of the 22 GHz and 43 GHz maps. We used the optically thin feature ∼2 mas to the west of the 22 GHz jet core (highlighted in red) to derive the relative shift between the two frequencies. The Gaussian model components are plotted on top of the contour clean maps. Vertical lines connect the components identified between both frequencies. The contours start at 3 times the noise level and increase logarithmically by factors of 2. The beam parameters for the 6 observations are listed in Table 1. Right panels: resulting spectral index maps between 22 GHz (dotted dashed blue contours) and 43 GHz (black contours) after applying the shifts on optically thin features. The restoring beam for each epoch is plotted in the lower left corner of the maps; the parameters are listed in Table 2. The blue star indicates the assumed location of the dynamical center.
Current usage metrics show cumulative count of Article Views (full-text article views including HTML views, PDF and ePub downloads, according to the available data) and Abstracts Views on Vision4Press platform.
Data correspond to usage on the plateform after 2015. The current usage metrics is available 48-96 hours after online publication and is updated daily on week days.
Initial download of the metrics may take a while.