Fig. A.3.
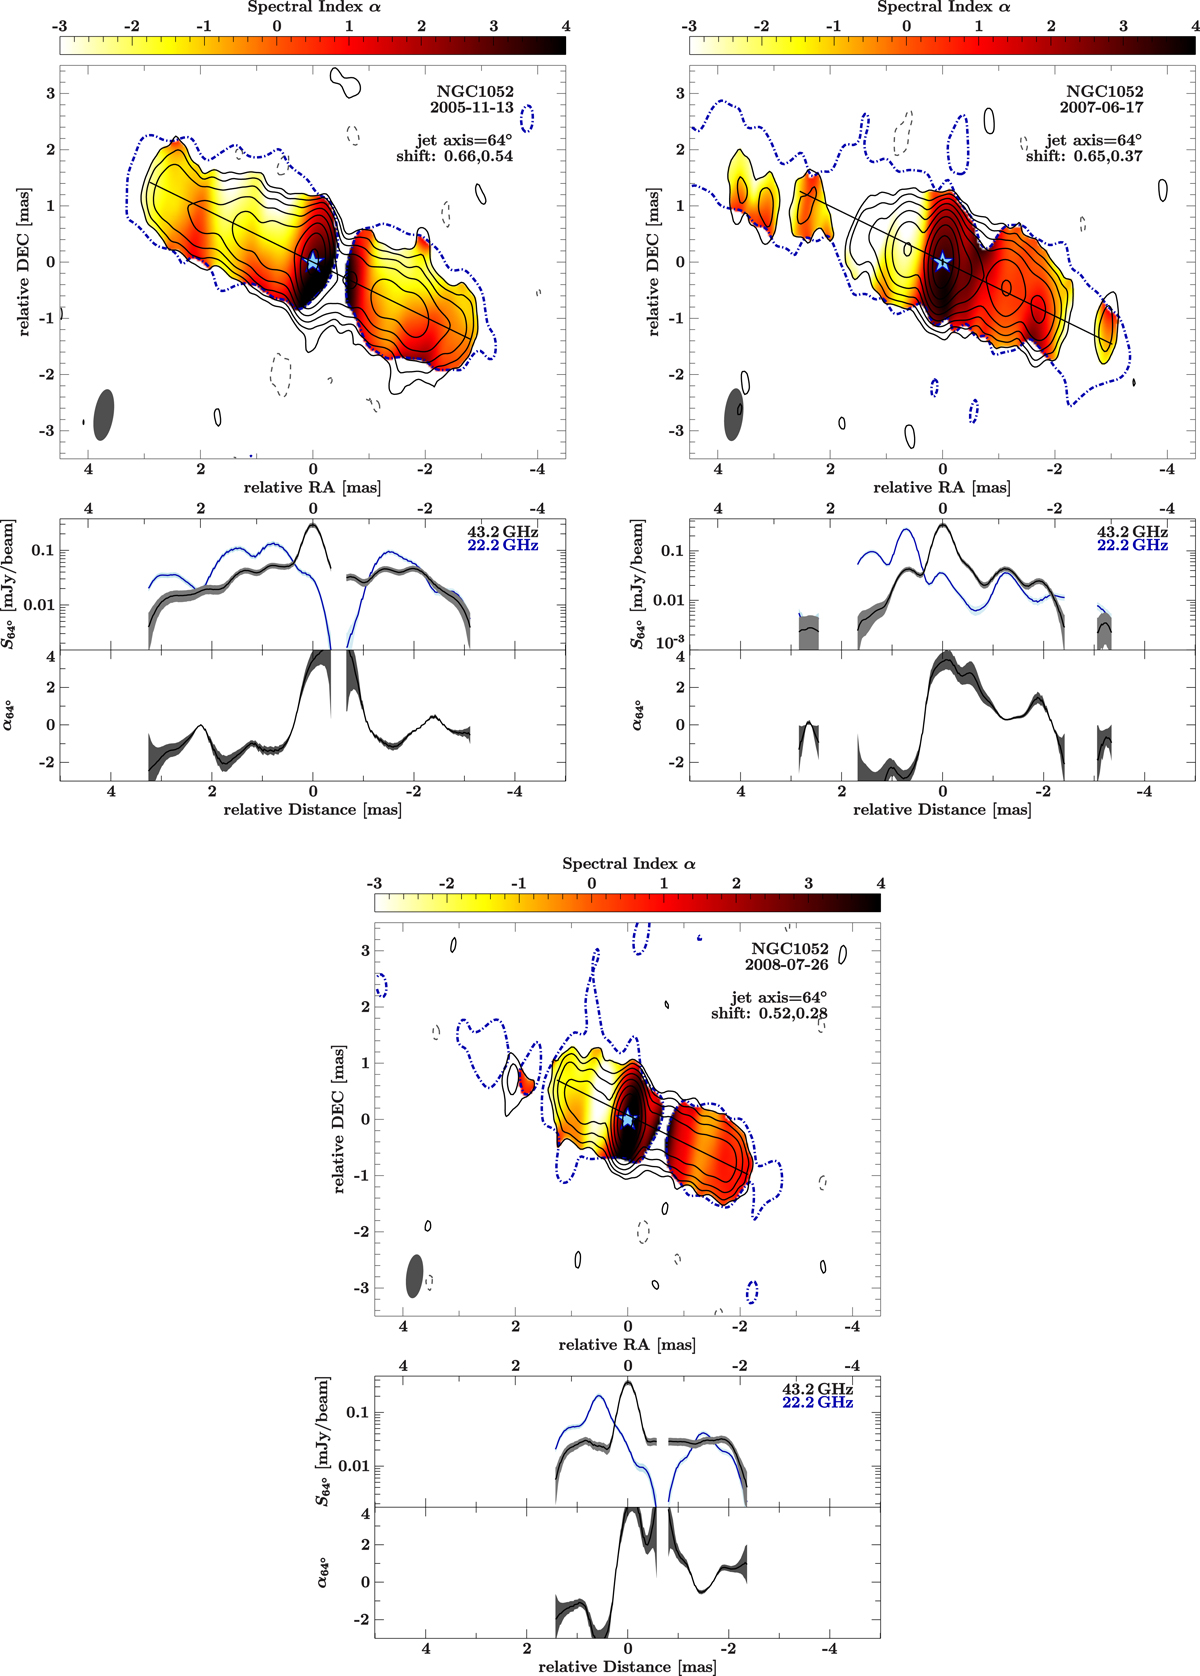
Spectral index maps between 22 GHz (dot-dashed blue contour) and 43 GHz (solid black contours) for three selected observations after alignment based on optically thin features (compare Fig. 2). The restoring beam for each epoch is plotted in the lower left corner. A cut along the direction of the jets (64°) results in the bottom panels, showing the spectral index (bottom panels) and the flux density (middle panel) along the jet axis. The blue star indicates the assumed location of the dynamical center.
Current usage metrics show cumulative count of Article Views (full-text article views including HTML views, PDF and ePub downloads, according to the available data) and Abstracts Views on Vision4Press platform.
Data correspond to usage on the plateform after 2015. The current usage metrics is available 48-96 hours after online publication and is updated daily on week days.
Initial download of the metrics may take a while.