Fig. 10.
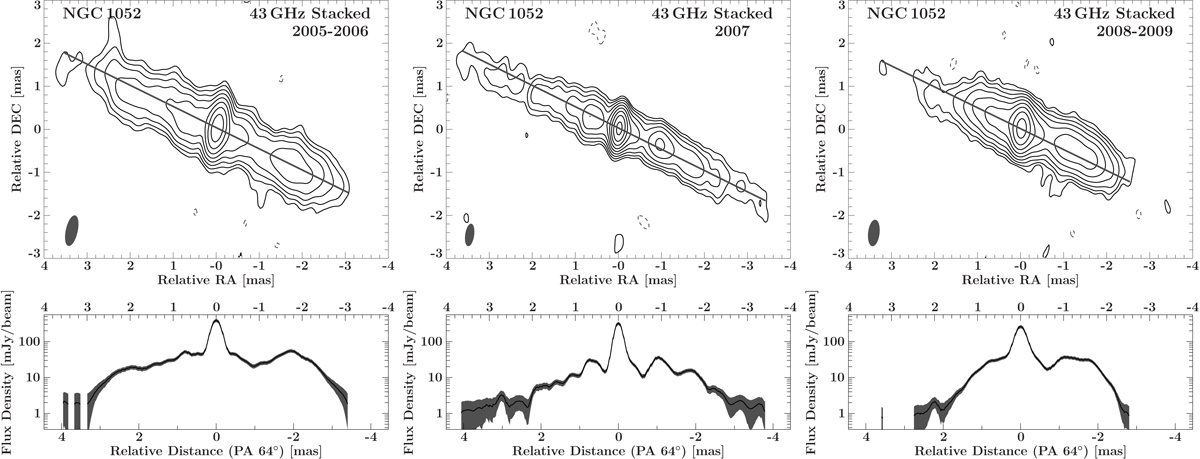
Stacked images (top panels) with the flux densities along the PA of the jet (bottom panels) for the observations from 2005 to 2006 (left panels), 2007 (middle panels), and 2008–2009 (right panels). The cut along the PA is indicated in the top panels as a line along the jet axis. The common beam for the stacked maps is shown in the bottom left corner of the top panels. For the stacked images the maps have been summed up and divided by the number of images. The contours start at 3 times the noise level and increase logarithmically by factors of 2.
Current usage metrics show cumulative count of Article Views (full-text article views including HTML views, PDF and ePub downloads, according to the available data) and Abstracts Views on Vision4Press platform.
Data correspond to usage on the plateform after 2015. The current usage metrics is available 48-96 hours after online publication and is updated daily on week days.
Initial download of the metrics may take a while.