Fig. 8
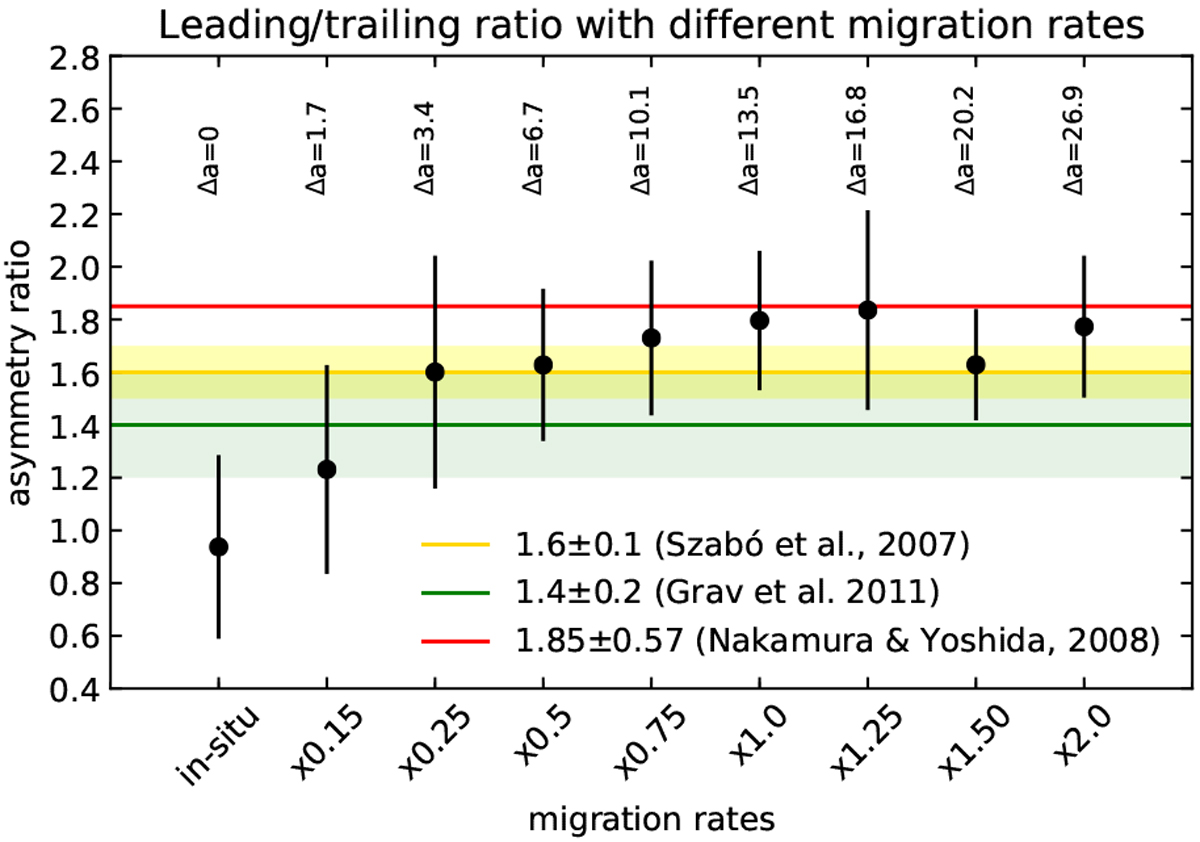
Asymmetry ratio, at t = 5 Myr, for different migration rates of the giant planets, plus the in situ scenario. The yellow shaded region highlights the observed asymmetry ratio of 1.6 ± 0.1 found by Szabó et al. (2007) and the green shaded region represents the observed asymmetry ratio of 1.4 ± 0.2 found by Grav et al. (2011). The red line indicates the estimated asymmetry ratio of 1.85 ± 0.57 found by Nakamura & Yoshida (2008). In this latter case the shaded region has not been overplotted to keep the figure readable, but the uncertainty is indicated in the legend. Above each asymmetry ratio it is noted the corresponding migration Δa that Jupiter undergoes.
Current usage metrics show cumulative count of Article Views (full-text article views including HTML views, PDF and ePub downloads, according to the available data) and Abstracts Views on Vision4Press platform.
Data correspond to usage on the plateform after 2015. The current usage metrics is available 48-96 hours after online publication and is updated daily on week days.
Initial download of the metrics may take a while.