Fig. 7
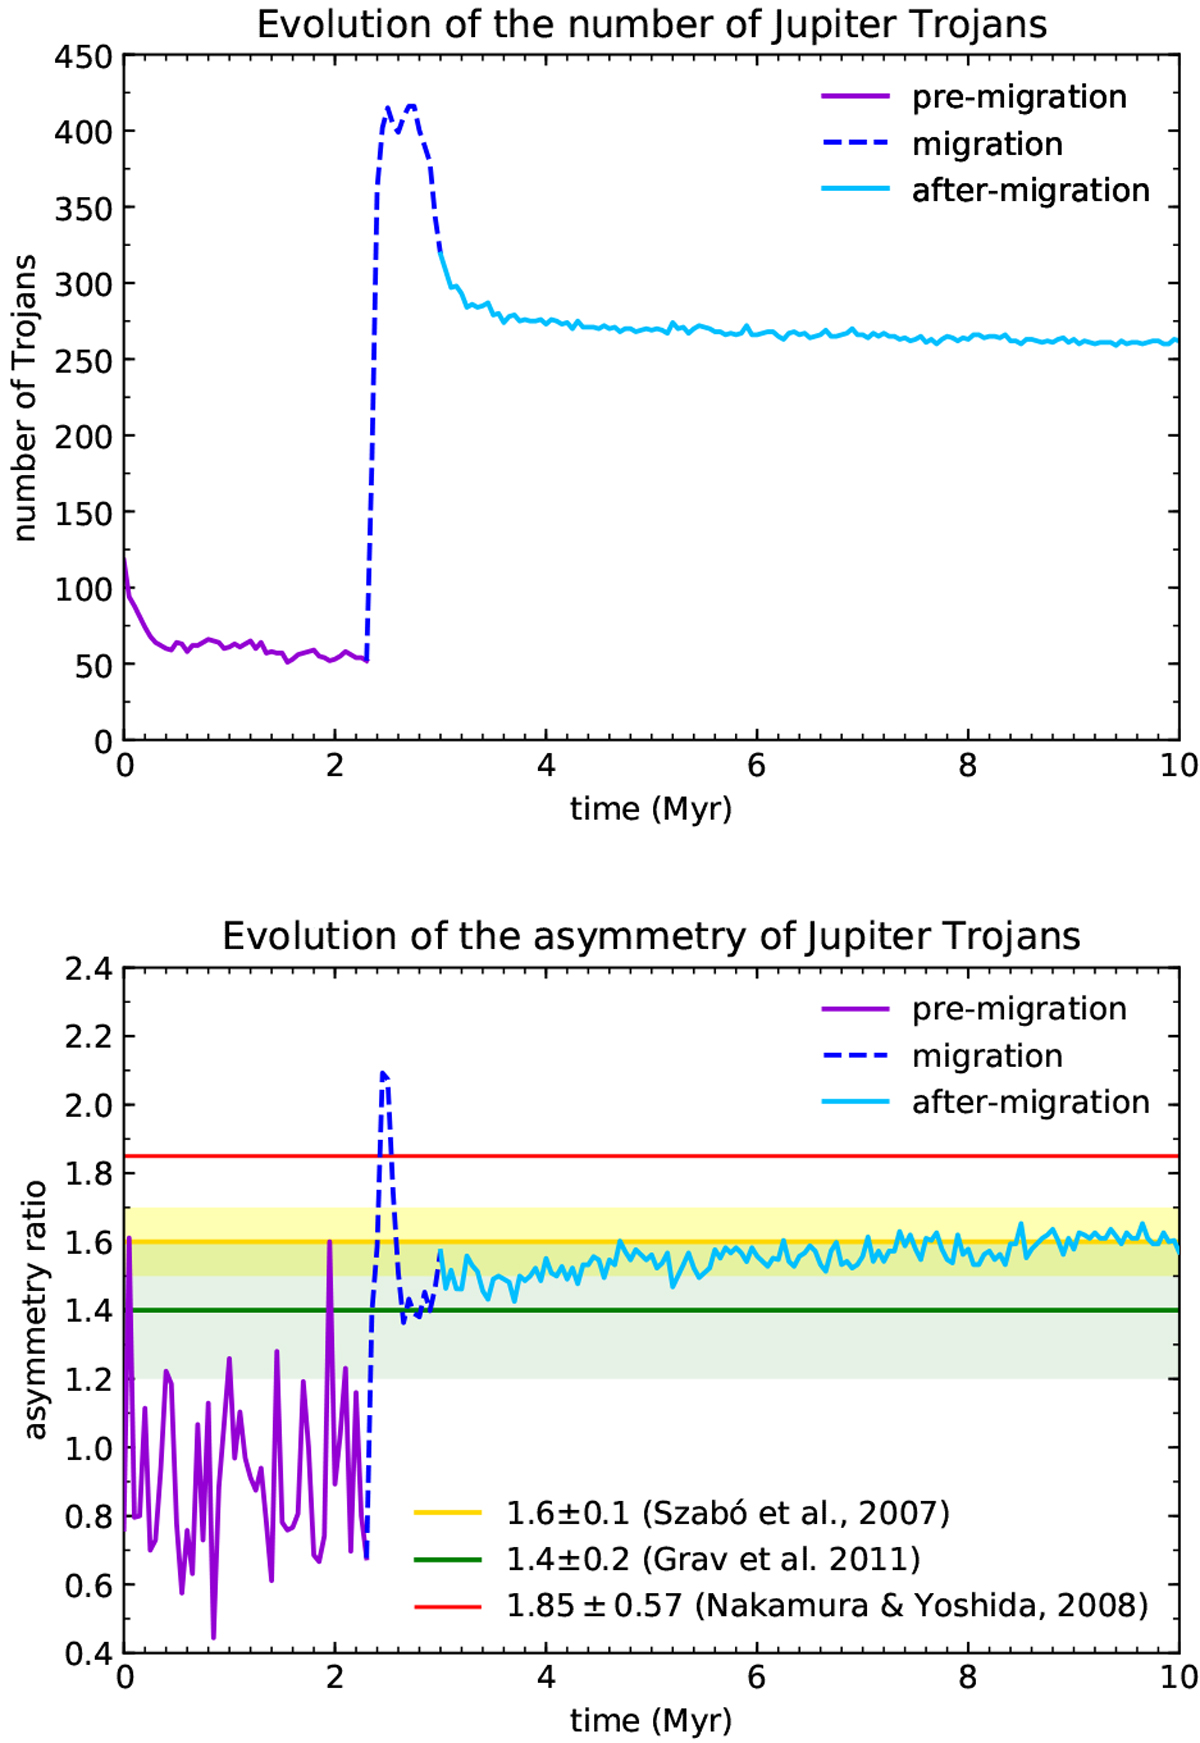
Evolution of the number of Trojan asteroids (top plot) and the asymmetry ratio between the L4 and L5 swarms (bottom plot). The migration of Jupiter starts at t ~ 2.3 Myr and stops at t = 3 Myr, when the protoplanetary disc photoevaporates. The green shaded region represents the observed values of the Trojan asymmetry found by Grav et al. (2011), the yellow shaded region represents the observed values of the Trojan asymmetry found by Szabó et al. (2007) and the red line represents the asymmetry ratio estimated in Nakamura & Yoshida (2008). In this latter case the shaded region has not been overplotted to keep the figure readable, but the uncertainty is indicated in the legend.
Current usage metrics show cumulative count of Article Views (full-text article views including HTML views, PDF and ePub downloads, according to the available data) and Abstracts Views on Vision4Press platform.
Data correspond to usage on the plateform after 2015. The current usage metrics is available 48-96 hours after online publication and is updated daily on week days.
Initial download of the metrics may take a while.