Fig. 6
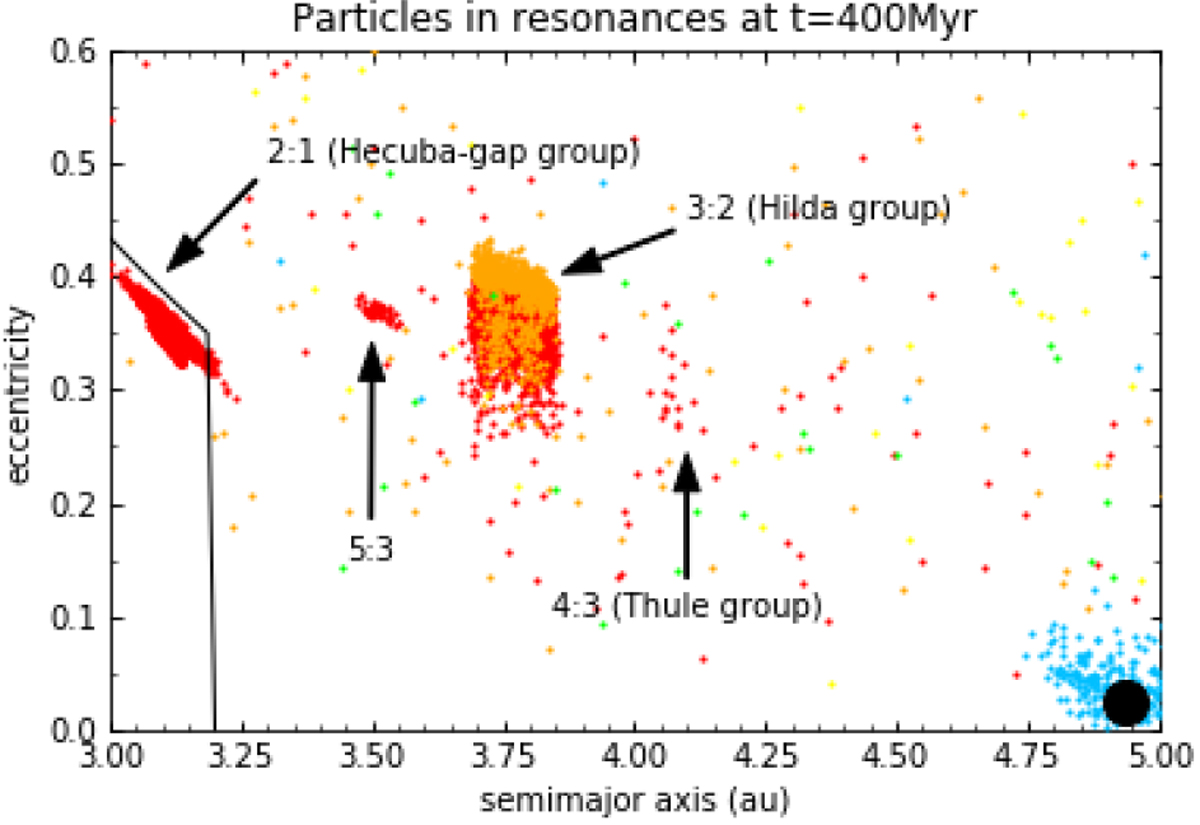
Zoom in of the region between 3 and 5 au in Fig. 4. It is possible to distinguish different resonant populations. From the left to the right in the plot: the Hecuba-gap group in the 2:1 mean motion resonance with Jupiter (3–3.25 au); a population in the second order 5:3 resonance with Jupiter (3.5 au); the Hilda asteroids in the 3:2 mean motion resonance with Jupiter (3.75 au); the Thule group in the 4:3 resonance (4.1 au). The black line roughly delimits the main belt region. We note that in this nominal case, due to interactions with the other planets, the final semimajor axis of Jupiter is about 5 au and the location of the resonances are slightly shifted inward.
Current usage metrics show cumulative count of Article Views (full-text article views including HTML views, PDF and ePub downloads, according to the available data) and Abstracts Views on Vision4Press platform.
Data correspond to usage on the plateform after 2015. The current usage metrics is available 48-96 hours after online publication and is updated daily on week days.
Initial download of the metrics may take a while.