Fig. 21
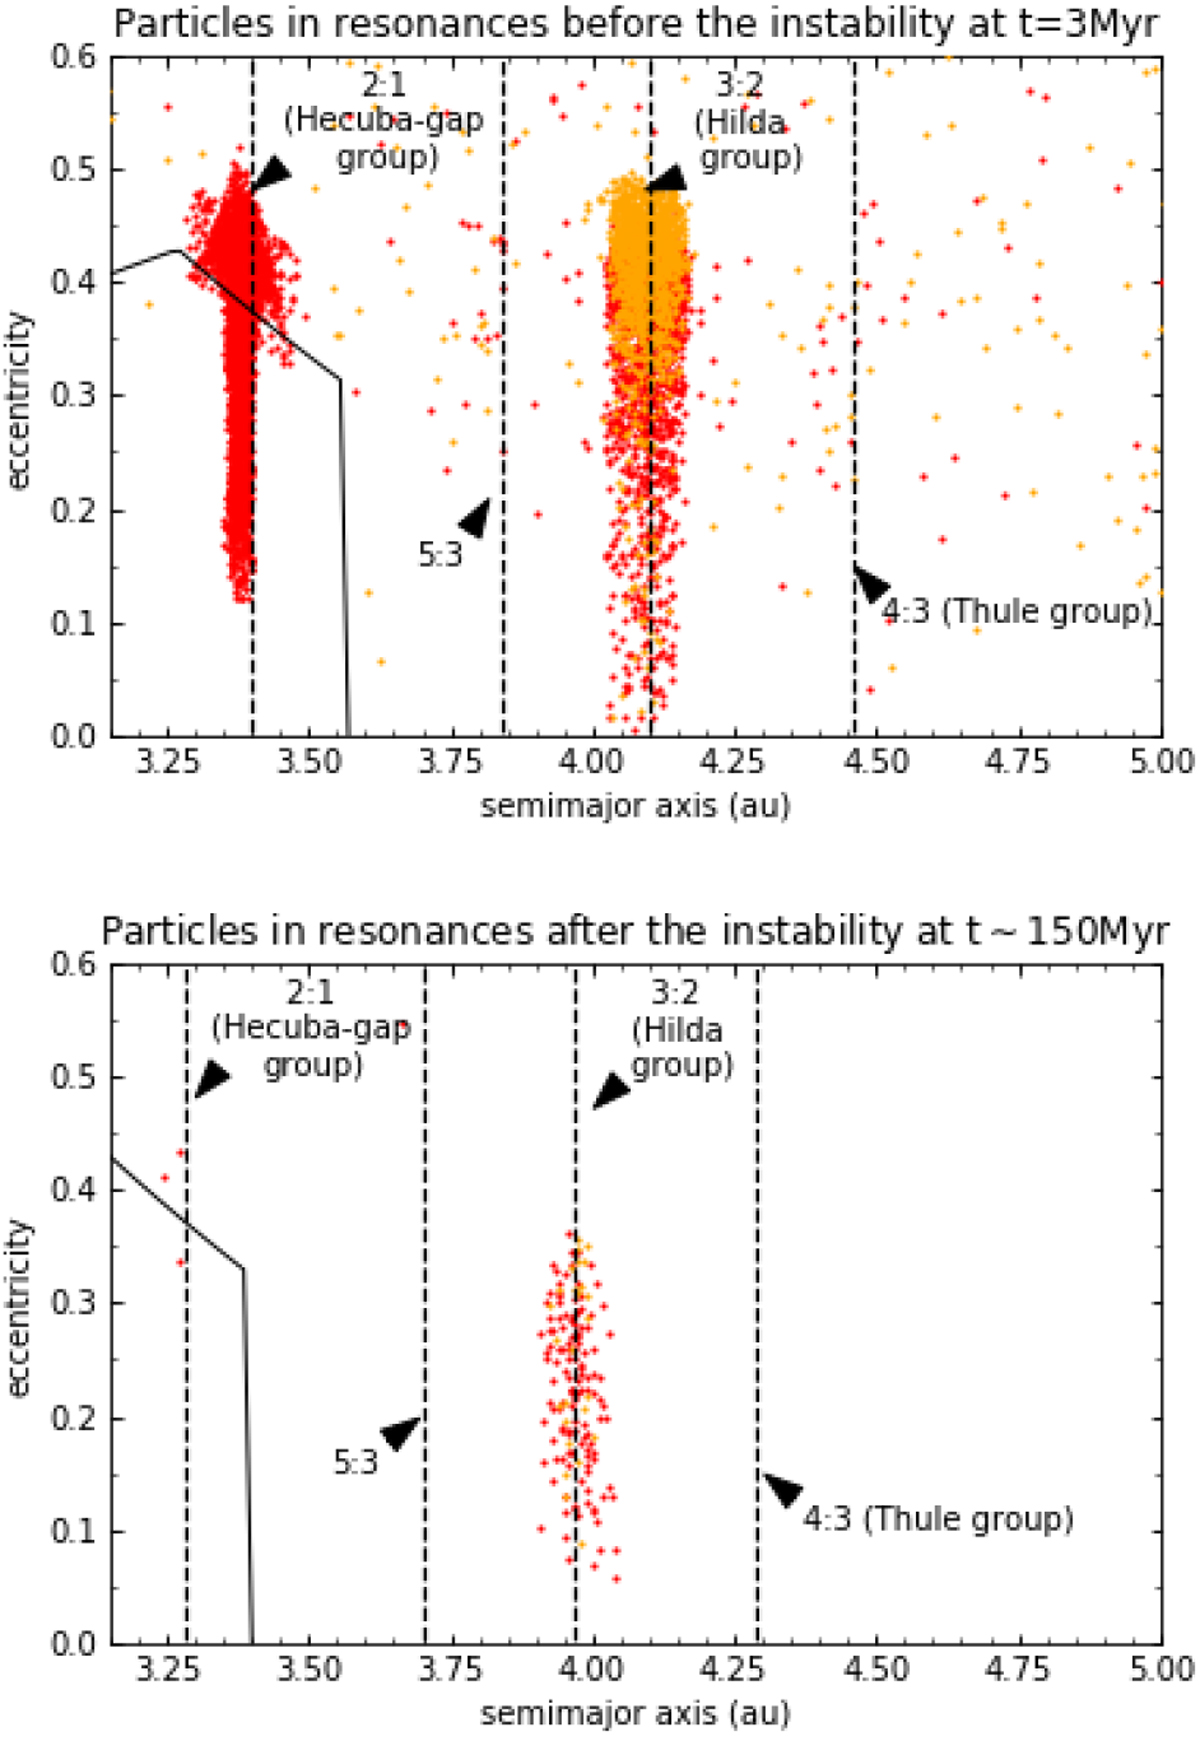
Top plot: resonant groups after the early inward migration of the giant planets at t = 3 Myr. Vertical dashed lines indicate roughly the positions of the resonances and the solid black line delimits the asteroid belt region. Bottom plot: fate of the resonant populations after the instability of the giant planets with a characteristic time scale of τ = 0.5 Myr, at t ~ 150 Myr. The resonance positions and the asteroid belt region are shifted in the bottom plot because Jupiter migrated from 5.4 to 5.2 au.
Current usage metrics show cumulative count of Article Views (full-text article views including HTML views, PDF and ePub downloads, according to the available data) and Abstracts Views on Vision4Press platform.
Data correspond to usage on the plateform after 2015. The current usage metrics is available 48-96 hours after online publication and is updated daily on week days.
Initial download of the metrics may take a while.