Fig. 2
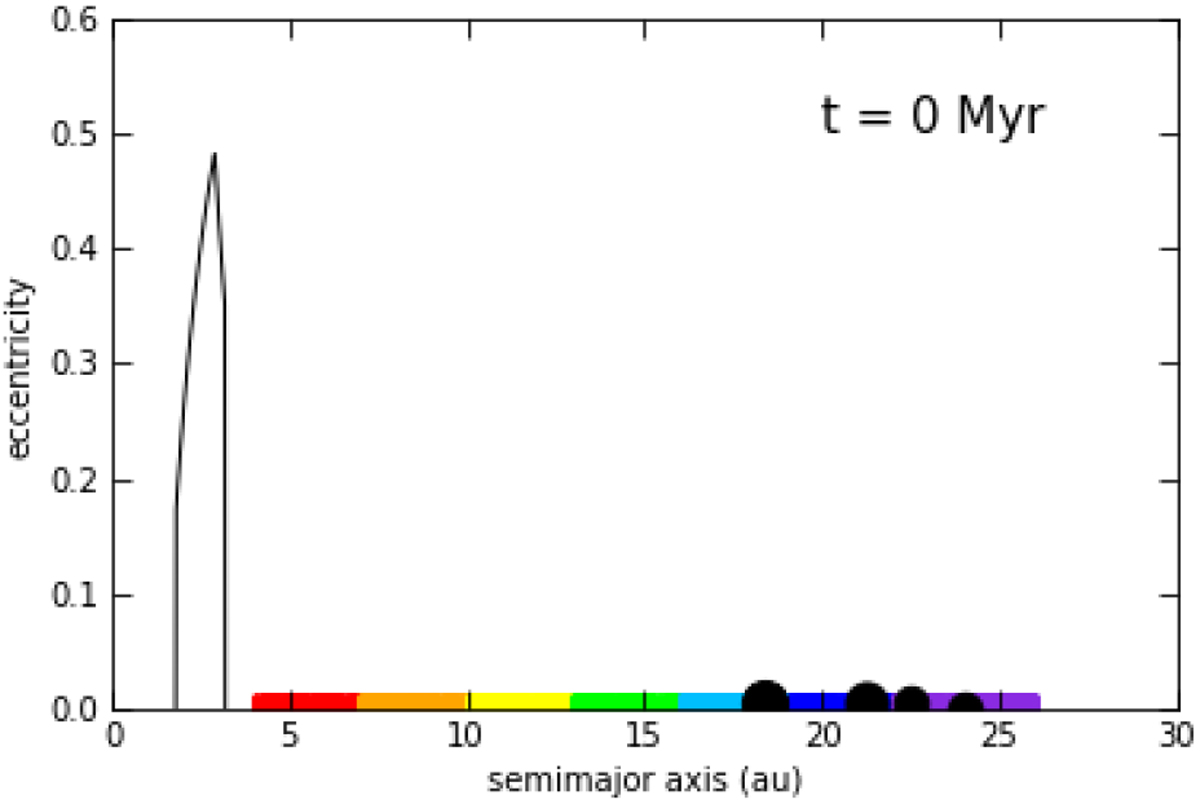
Initial configuration of the solar system in the nominal model. The plot shows colour-coded small bodies, from 4 to 26 au, starting with eccentricities in the [0 : 0.01] range. We used different colours for the small particles to easily track them during the simulations. The black filled dots at 18 (Jupiter), 21 (Saturn), 22 (Uranus) and 24 au (Neptune) are the giant planets seeds. The black line roughly delimits the actual main belt region, from 2 to 3.4 au, with a cut for perihelion distances smaller than 1.7 (particles strongly affected by the presence of Mars) and a cut for aphelion distances greater than 4.5 (particles strongly affected by the presence of Jupiter).
Current usage metrics show cumulative count of Article Views (full-text article views including HTML views, PDF and ePub downloads, according to the available data) and Abstracts Views on Vision4Press platform.
Data correspond to usage on the plateform after 2015. The current usage metrics is available 48-96 hours after online publication and is updated daily on week days.
Initial download of the metrics may take a while.