Fig. 18
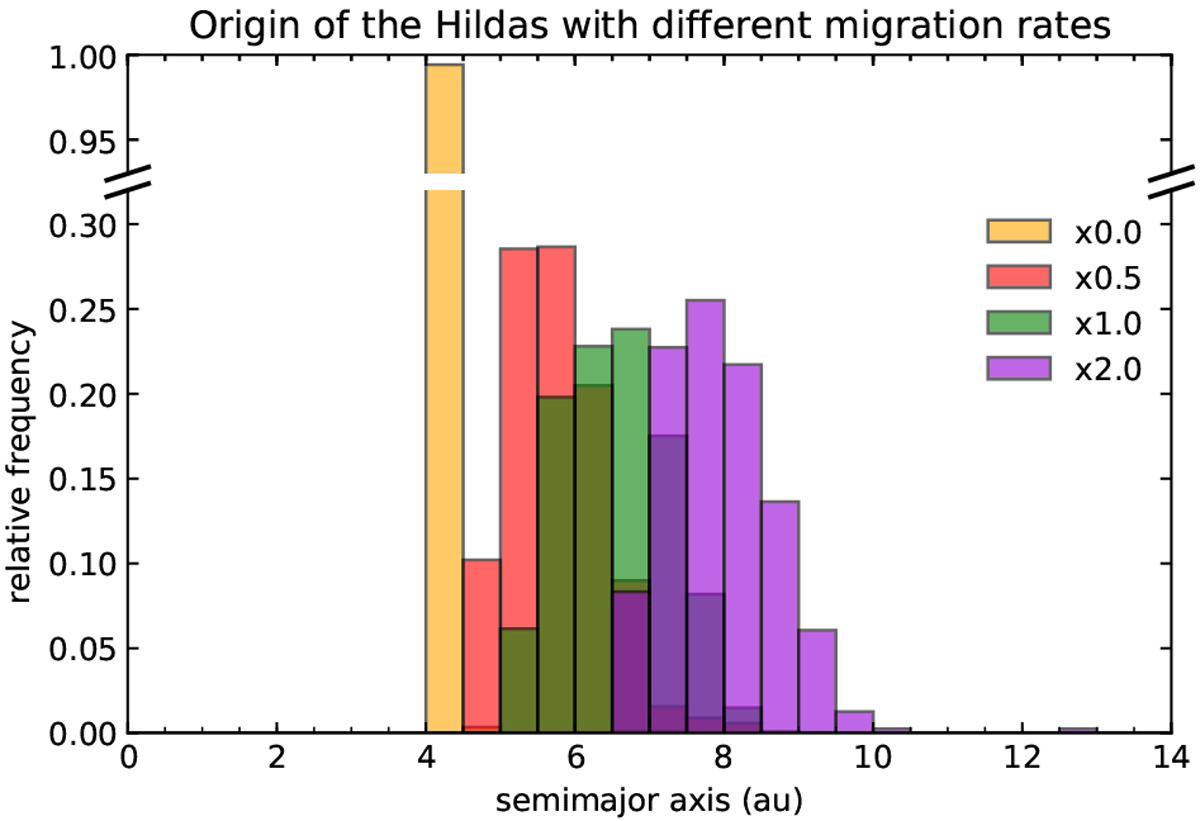
Origin of the Hilda asteroids with different migration rates. The yellow histogram is referred to the in situ growth model, the red histogram corresponds to a migration rate 0.5 times slower than the nominal one. The green one is the result for the nominal model and the purple one corresponds to a migration rate 2 times faster than the nominal model.
Current usage metrics show cumulative count of Article Views (full-text article views including HTML views, PDF and ePub downloads, according to the available data) and Abstracts Views on Vision4Press platform.
Data correspond to usage on the plateform after 2015. The current usage metrics is available 48-96 hours after online publication and is updated daily on week days.
Initial download of the metrics may take a while.