Fig. 14
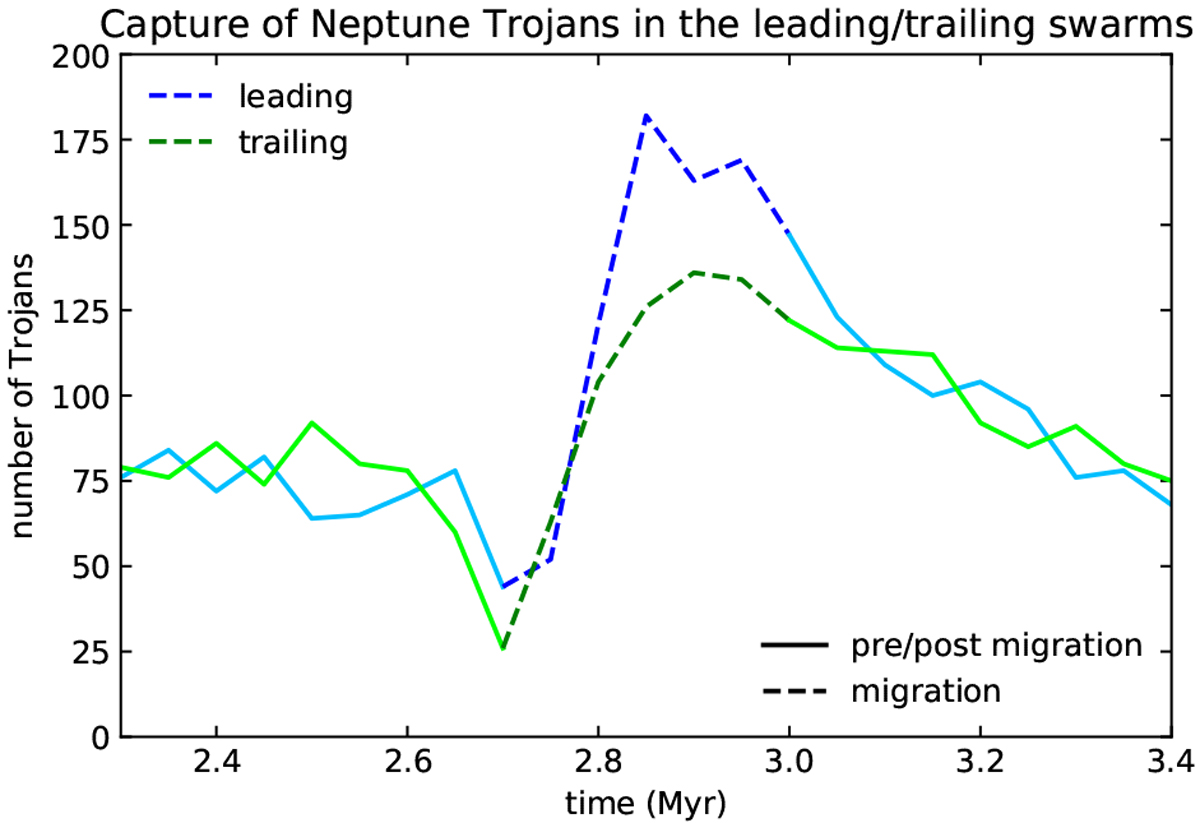
Number of particles in the leading and trailing side of the horseshoe orbits during the nominal model migration and growth of Neptune. The blue line is the number of particles in the L4 side of the horseshoe orbit (leading side) versus time and the green line is the number of particles in the L5 side of the horseshoe orbit (trailing side) versus time. We can clearly see an excess of leading particles during the growth and migration due to the deformations of the horseshoe orbit, but Neptune has not grown enough to shrink the orbits to stable tadpole orbits in order to preserve the asymmetry. Then when the migration stops the excess simply disappears because the horseshoe orbits are back symmetric. Dashed lines indicate the time frame where Neptune is growing and migrating.
Current usage metrics show cumulative count of Article Views (full-text article views including HTML views, PDF and ePub downloads, according to the available data) and Abstracts Views on Vision4Press platform.
Data correspond to usage on the plateform after 2015. The current usage metrics is available 48-96 hours after online publication and is updated daily on week days.
Initial download of the metrics may take a while.