Fig. 13
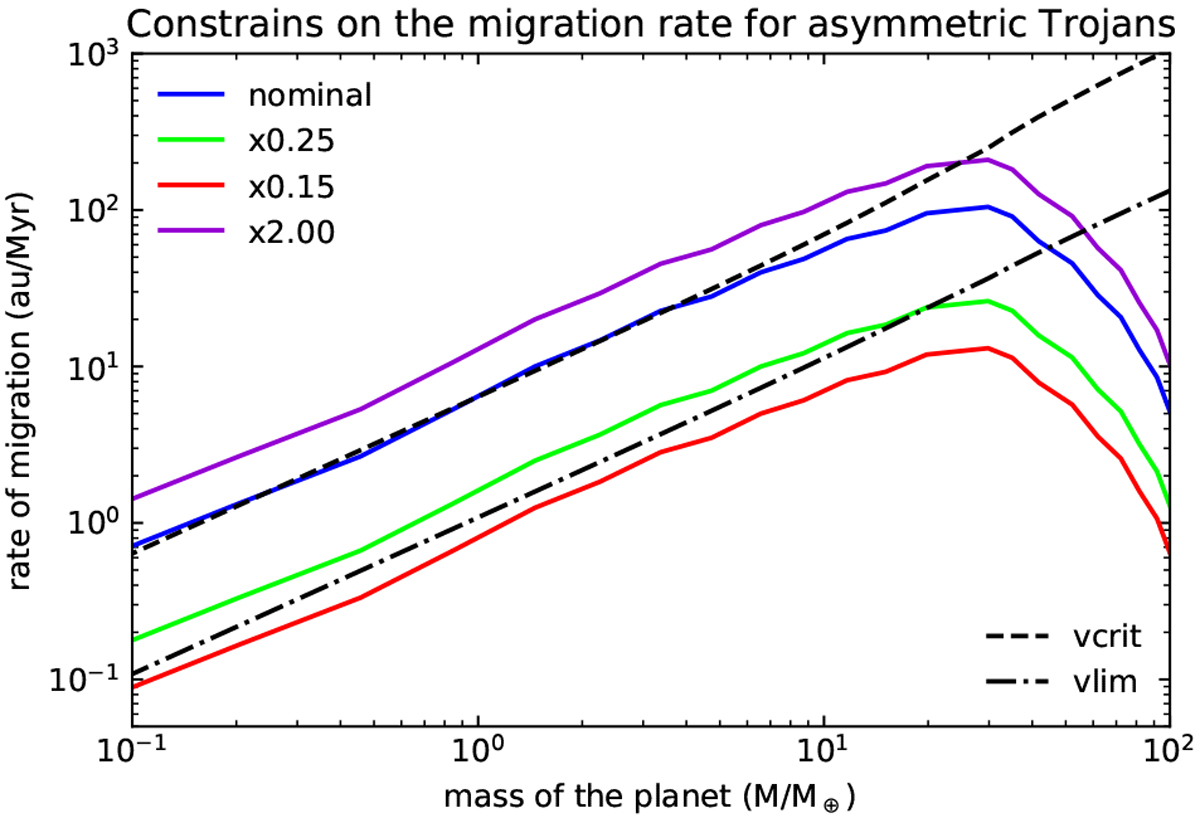
Migration rates for the nominal model (blue line), the growth track 2 times faster than the nominal one (violet line) and the growth tracks 0.25 and 0.15 times the nominal one (green and red line, respectively). The black dashed line represents the critical migration rate at which L3 and L4 start to merge and disappear vcrit ≈ 1.45qΩr (Ogilvie & Lubow 2006). The black dash-dotted line represents the lower limit for the migration rate to get an asymmetry comparable with the one observed and estimated in our simulations, that is vlim ≈ 0.17qΩr.
Current usage metrics show cumulative count of Article Views (full-text article views including HTML views, PDF and ePub downloads, according to the available data) and Abstracts Views on Vision4Press platform.
Data correspond to usage on the plateform after 2015. The current usage metrics is available 48-96 hours after online publication and is updated daily on week days.
Initial download of the metrics may take a while.