Fig. 11
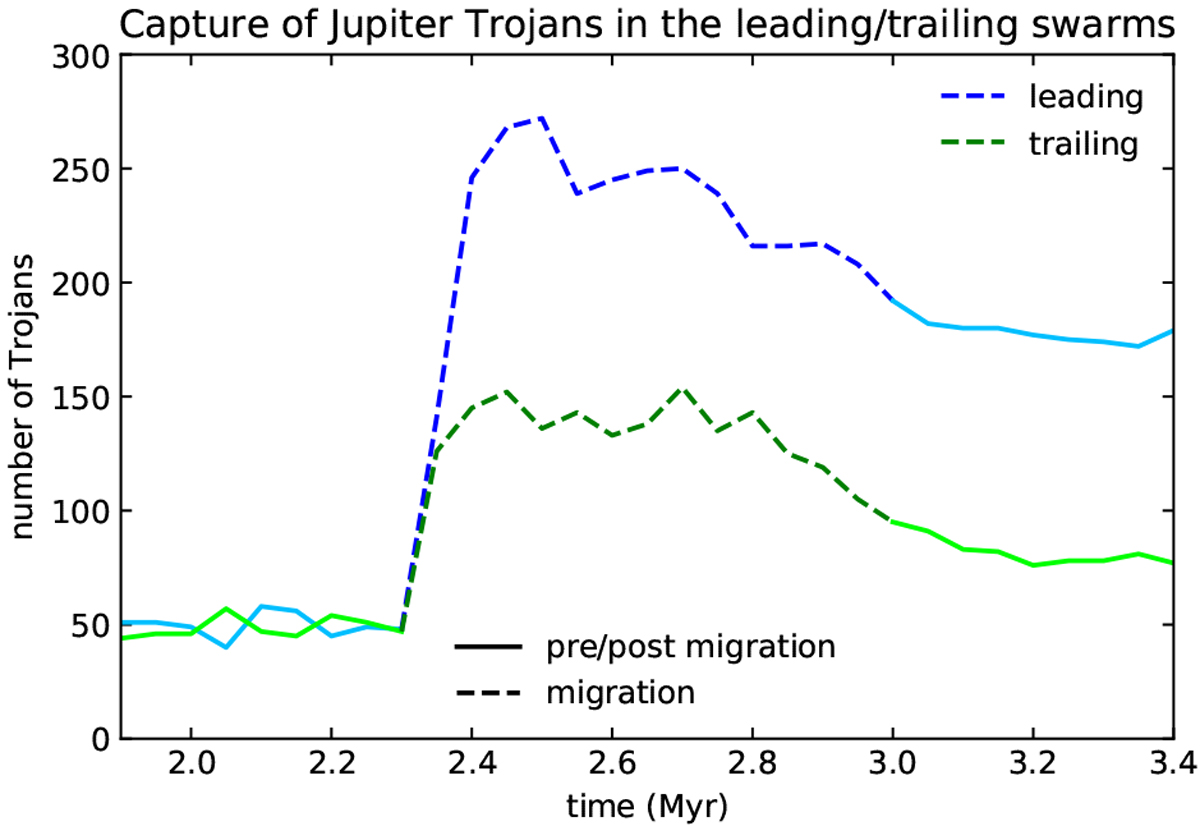
Number of particles in the leading and trailing side of the horseshoe orbits during the nominal model migration and growth of Jupiter. The blue line is the number of particles in the L4 side of the horseshoe orbit (leading side) versus time and the green line is the number of particles in the L5 side of the horseshoe orbit (trailing side) versus time. Horseshoe orbit encompass both L4 and L4, hence an excess of leading particles means that particles spend more time in the leading part of the orbit. Dashed lines indicate the time frame where Jupiter is growing and migrating.
Current usage metrics show cumulative count of Article Views (full-text article views including HTML views, PDF and ePub downloads, according to the available data) and Abstracts Views on Vision4Press platform.
Data correspond to usage on the plateform after 2015. The current usage metrics is available 48-96 hours after online publication and is updated daily on week days.
Initial download of the metrics may take a while.