Fig. 9.
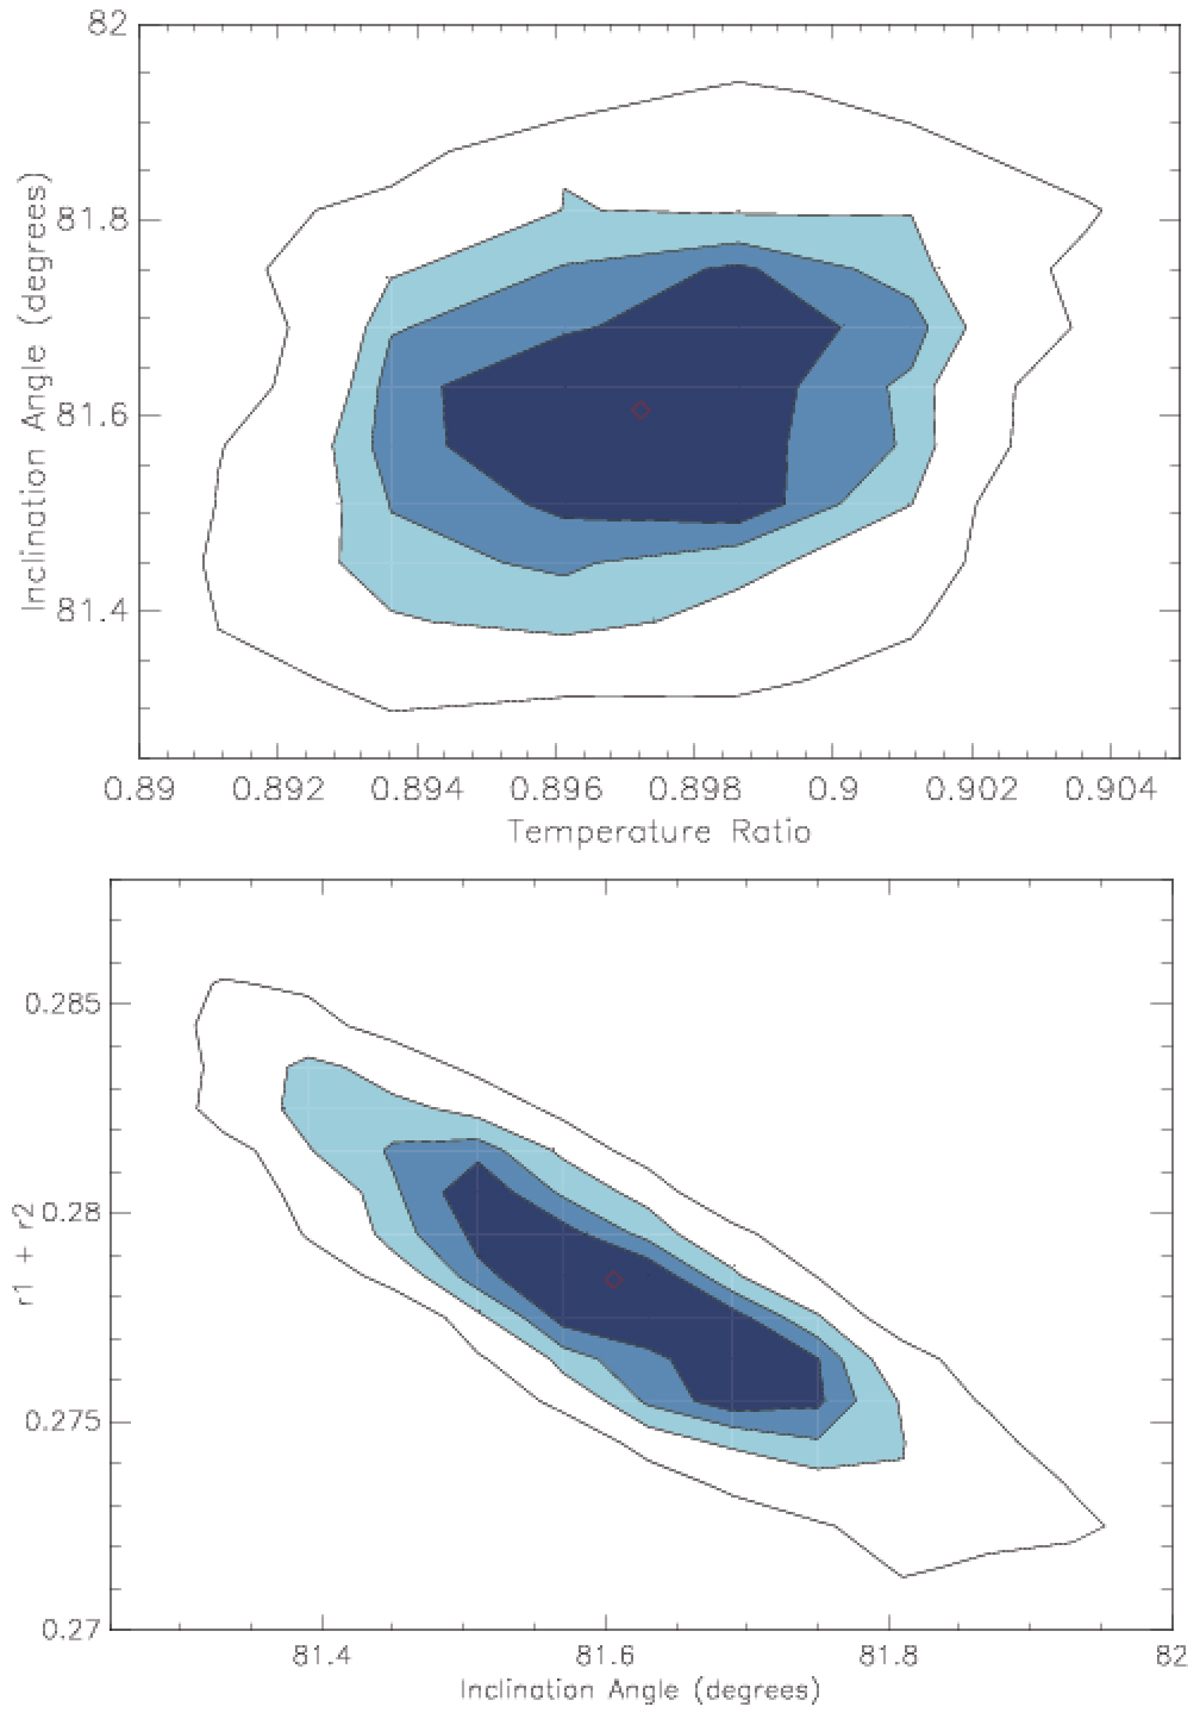
Confidence levels for inclination, Sum of the fractional radii and temperature ratio derived from the VRCIC light curves. Top panel: from the center the 1-, 2-, 3- and 5-σ contours of the inclination of the eclipsing binary orbit and the temperature ratio (Teff, 2/Teff, 1). The confidence levels were determined from the exploration of the χ2–space, and the best-fit solution to the RV and VRCIC light curves is the one with the lowest χ2 (marked by the red diamond in both panels). Bottom panel: sum of the fractional radii (i.e., r1 + r2) as a function of the inclination angle. The contours represent the same confidence levels as in the top panel.
Current usage metrics show cumulative count of Article Views (full-text article views including HTML views, PDF and ePub downloads, according to the available data) and Abstracts Views on Vision4Press platform.
Data correspond to usage on the plateform after 2015. The current usage metrics is available 48-96 hours after online publication and is updated daily on week days.
Initial download of the metrics may take a while.