Fig. 7.
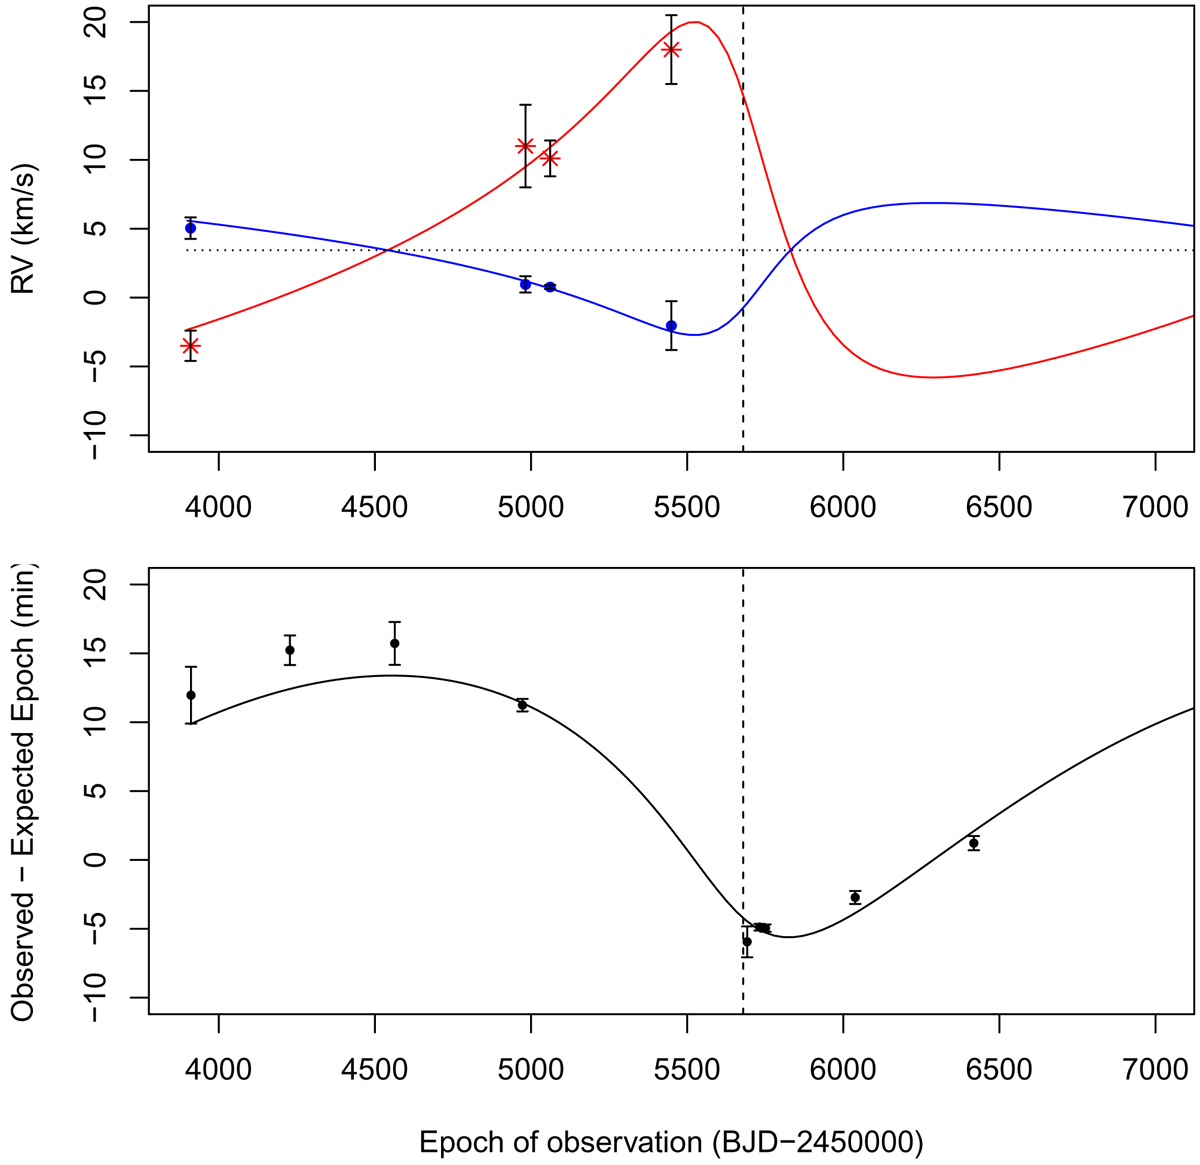
Top panel: radial velocities for eclipsing binary system and tertiary star. We present the observed radial velocity curve for the tertiary star (red asterisks) and the systemic radial velocity of the eclipsing binary (blue circles) compared to the best fitting model radial velocity curves derived from the MCMC analysis described in Sect. 3.3. Bottom panel: measured eclipse timings offsets. We show the measured change in the time at which the eclipse occurred due to the light-time travel effect as it orbits the center of mass of the three-body system compared to the best-fit Keplerian model (solid black line). The vertical dashed line represents the time of periastron passage. This does not occur at the maximum radial velocity because it occurs at the maximum 3-dimensional velocity which is close to, but not exactly the same as the line-of-sight peak.
Current usage metrics show cumulative count of Article Views (full-text article views including HTML views, PDF and ePub downloads, according to the available data) and Abstracts Views on Vision4Press platform.
Data correspond to usage on the plateform after 2015. The current usage metrics is available 48-96 hours after online publication and is updated daily on week days.
Initial download of the metrics may take a while.