Fig. 6.
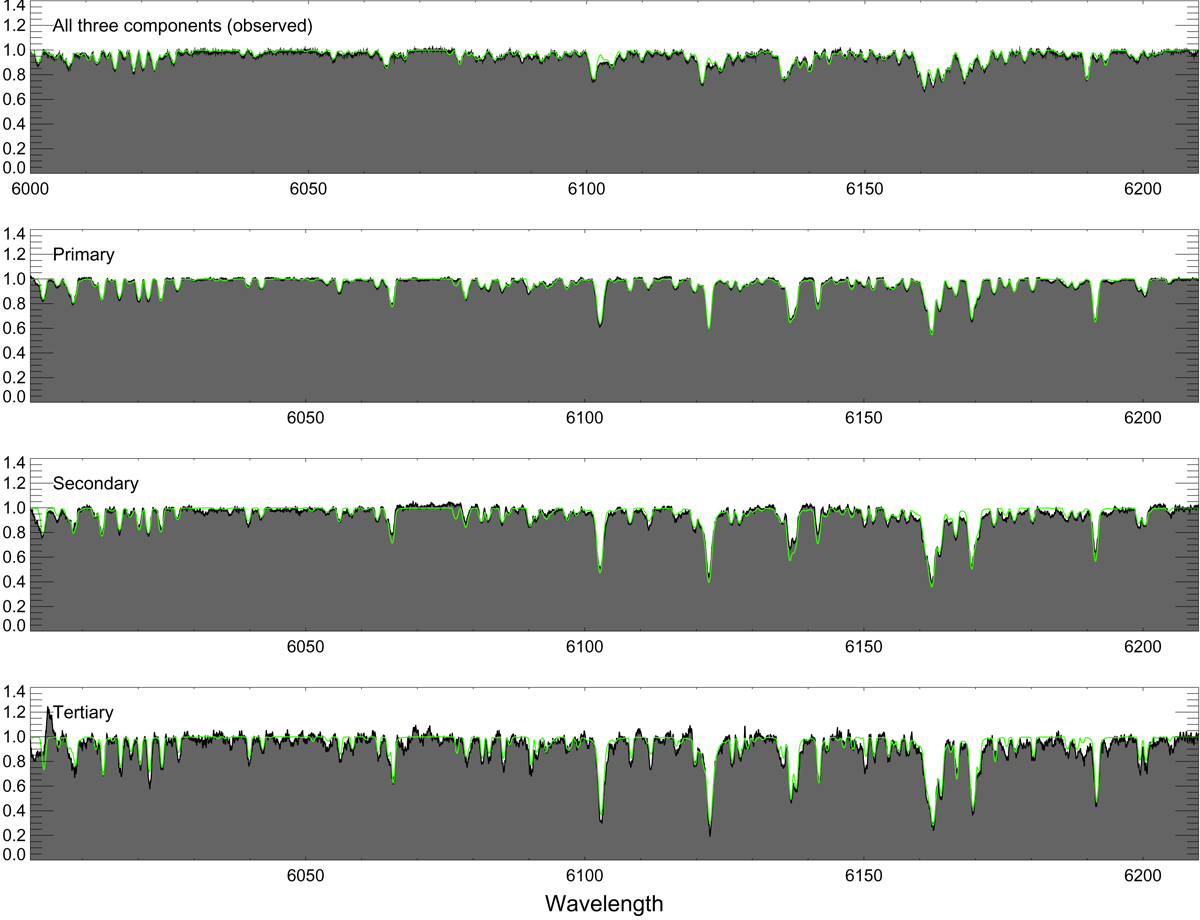
Observed spectrum of MML 53 and model spectra of all three stellar components. This figure illustrates the agreement between the observed spectrum of MML 53 (black solid line and gray underlying area) and synthetic model spectra (green) for each of the three stars in the system. Top panel: spectrum as observed on 18 August 2009, when the absorption lines of this triple-lined spectroscopic system were well separated. Bottom three panels: disentangled spectra of each individual stellar component. The synthetic spectrum in the top panel is a luminosity-weighted combination of the synthetic spectra shown in the lower panels, taking into account the radial velocity offset of each component.
Current usage metrics show cumulative count of Article Views (full-text article views including HTML views, PDF and ePub downloads, according to the available data) and Abstracts Views on Vision4Press platform.
Data correspond to usage on the plateform after 2015. The current usage metrics is available 48-96 hours after online publication and is updated daily on week days.
Initial download of the metrics may take a while.