Fig. 5.
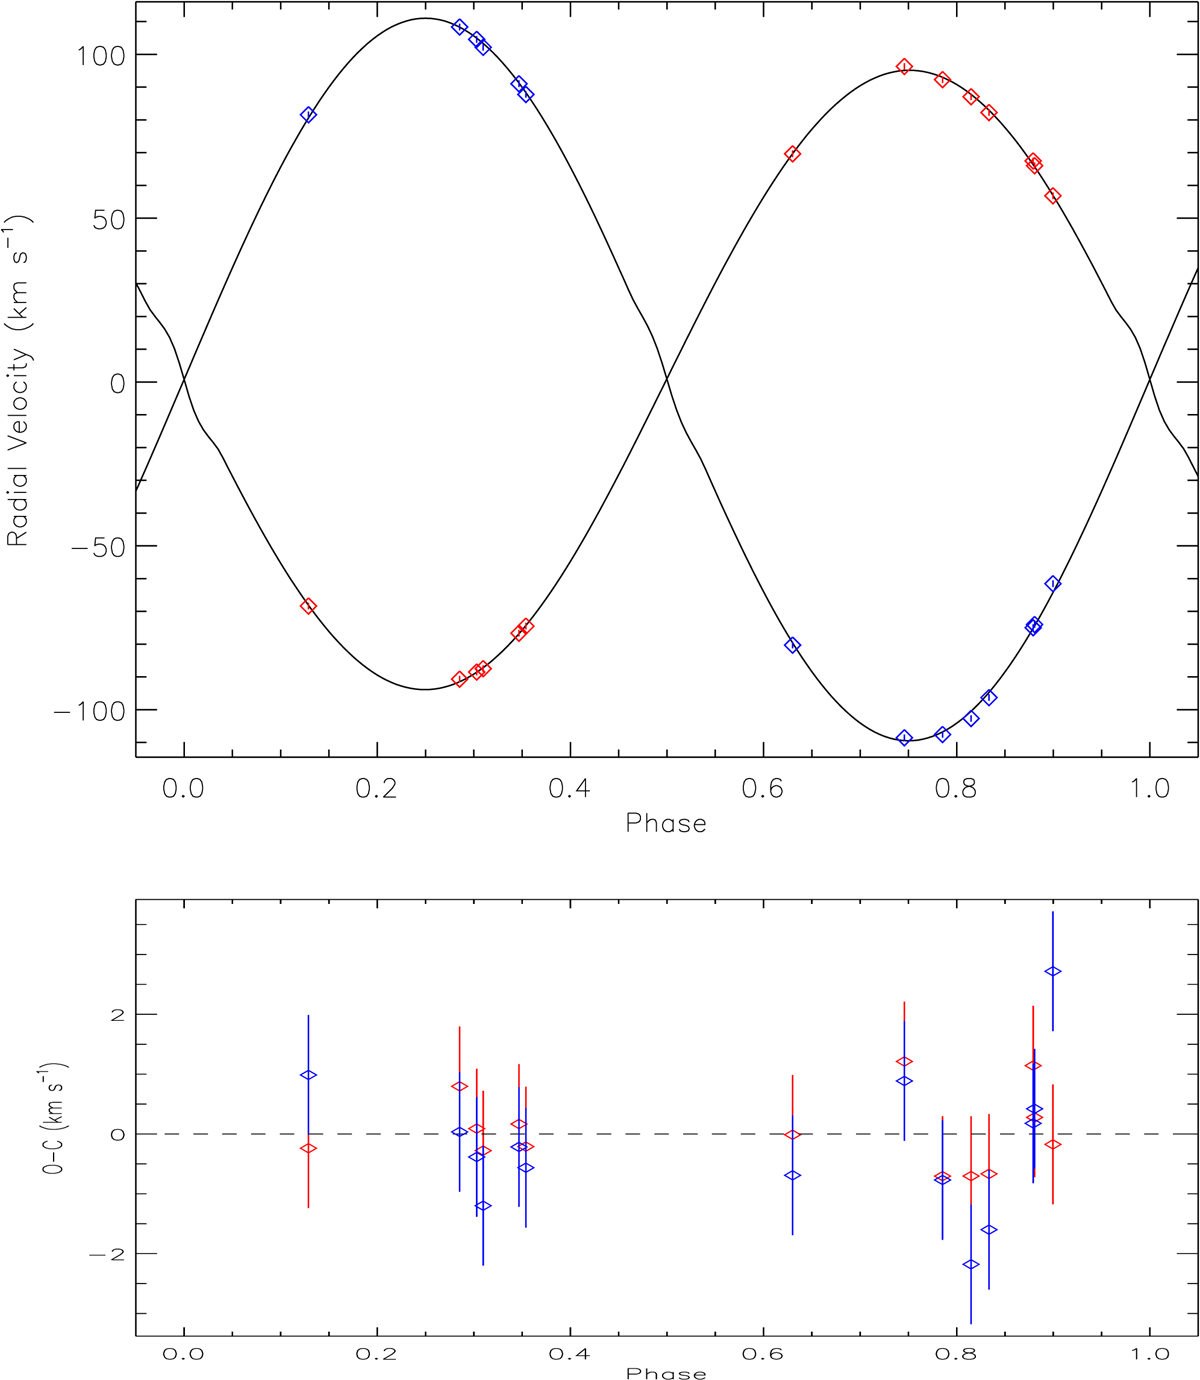
UVES radial velocity curves and best-fit model. Top panel: radial velocity measurements from the UVES data. The red points correspond to the primary RV measurements, and the blue points to the secondary RVs. The errors in the RV measurements are also shown, but are smaller than the data points. The continuous black lines correspond to the best-fit model of the Keplerian orbit of the eclipsing components. Bottom panel: residuals to the fit in red for the primary and in blue for the secondary, and the uncertainties that correspond to the error in each RV measurement. The rms in the residuals are comparable to the errors in the RV measurements, ∼0.6 km s−1 for the primary and ∼1.1 km s−1 for the secondary.
Current usage metrics show cumulative count of Article Views (full-text article views including HTML views, PDF and ePub downloads, according to the available data) and Abstracts Views on Vision4Press platform.
Data correspond to usage on the plateform after 2015. The current usage metrics is available 48-96 hours after online publication and is updated daily on week days.
Initial download of the metrics may take a while.