Fig. 3.
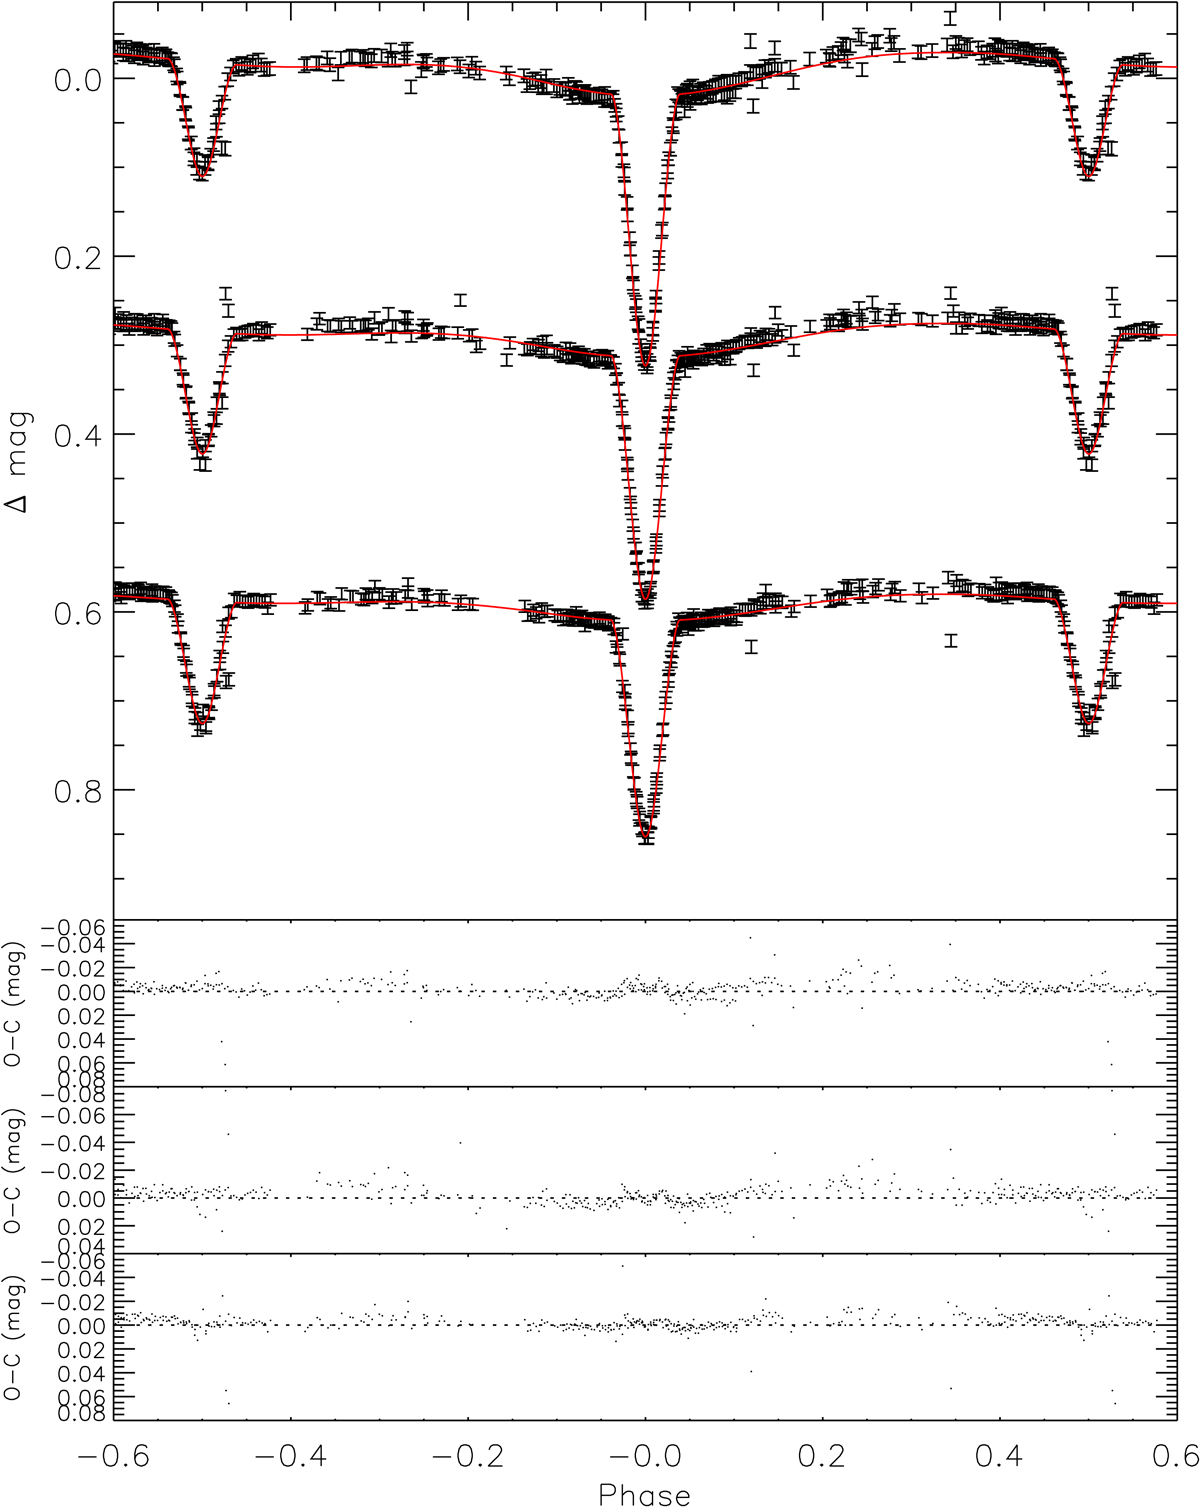
CTIO VRCIC photometry with the best-fit model light curves. Top panel: CTIO time-series photometry of MML 53, from the top are the V–, RC–, and IC–band differential photometry measurements shown by the black points with individual error. The light curves were arbitrarily separated in Δmag for clarity. The model light curves corresponding to the final solution, including third light and stellar spots (Sect. 3.2.1), are shown by the continuous red lines. Three bottom panels: residuals to the best fit model for each of the light curves, V, RC, and IC, respectively from the top. Our solution is able to reproduce well the duration and depth of the eclipses in the different bands and the variation attributed to spots. The rms in the residuals in each filter (∼8 mmag) are comparable to the errors in the photometric measurements.
Current usage metrics show cumulative count of Article Views (full-text article views including HTML views, PDF and ePub downloads, according to the available data) and Abstracts Views on Vision4Press platform.
Data correspond to usage on the plateform after 2015. The current usage metrics is available 48-96 hours after online publication and is updated daily on week days.
Initial download of the metrics may take a while.