Fig. 2.
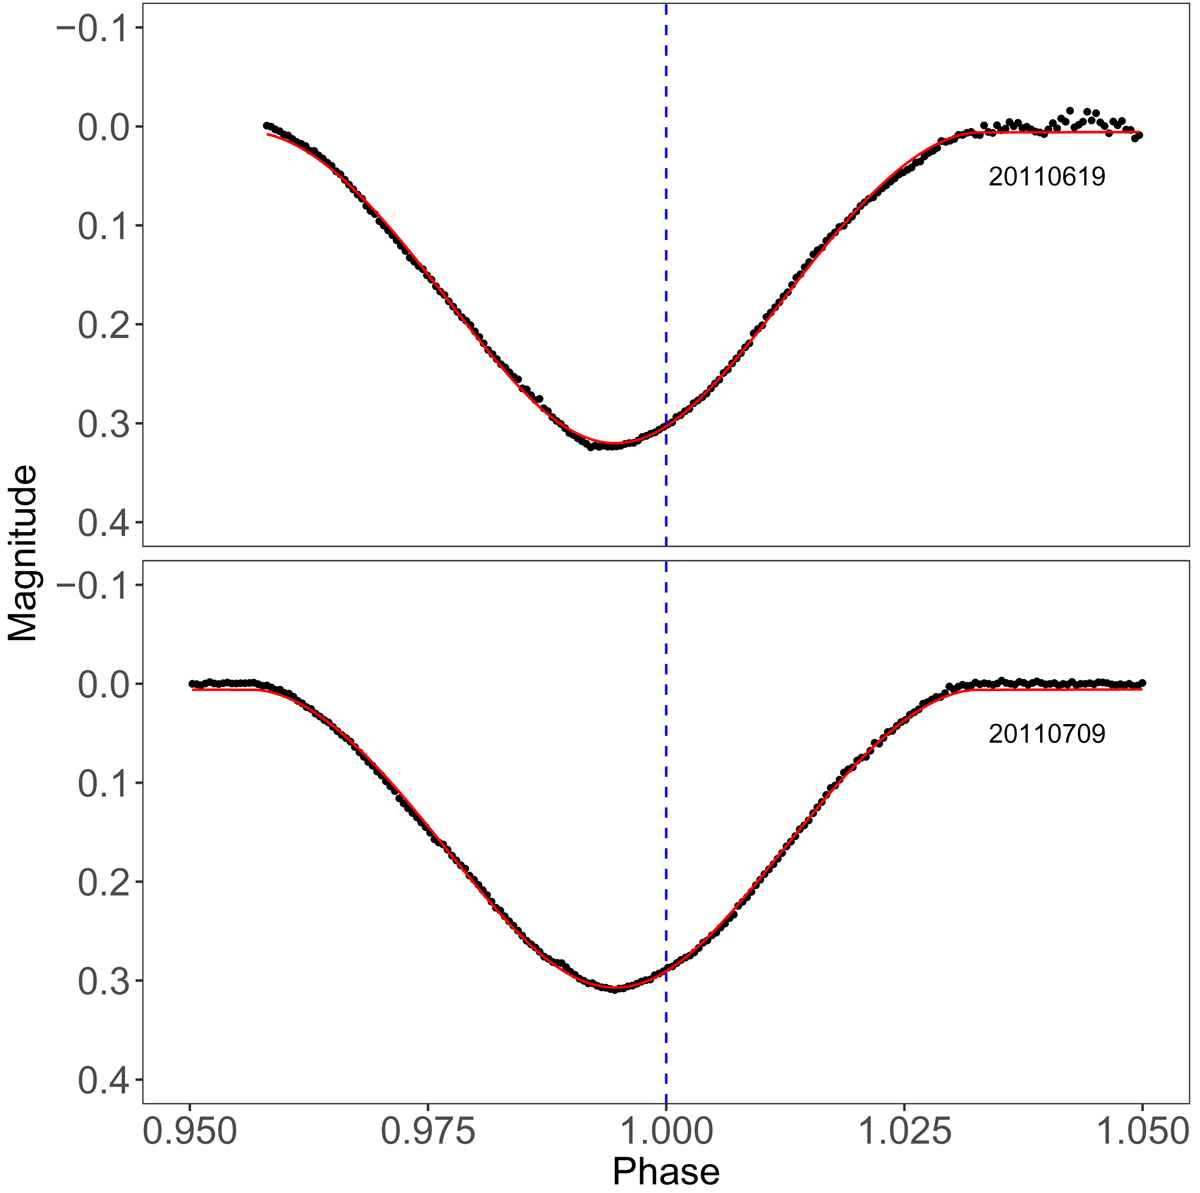
Differential V-band light curves of two primary eclipses of MML 53 taken on 19 June 2011 and 9 July 2011 with FTS. The data were converted to phase with the ephemeris derived from the detailed modeling of the 2009 CTIO data (Porb = 2.097892 ± 0.000005 d) and time of minimum light in BJDTDB units, T0 = 2454972.650850 shown with the vertical, dashed line. Noticeable shifts in the time of eclipse minima due to the tertiary component are visible in these data. Best fitting EB model light curves (described in Sect. 3.3.1) are over plotted in red on all rectified light curves.
Current usage metrics show cumulative count of Article Views (full-text article views including HTML views, PDF and ePub downloads, according to the available data) and Abstracts Views on Vision4Press platform.
Data correspond to usage on the plateform after 2015. The current usage metrics is available 48-96 hours after online publication and is updated daily on week days.
Initial download of the metrics may take a while.