Fig. 12.
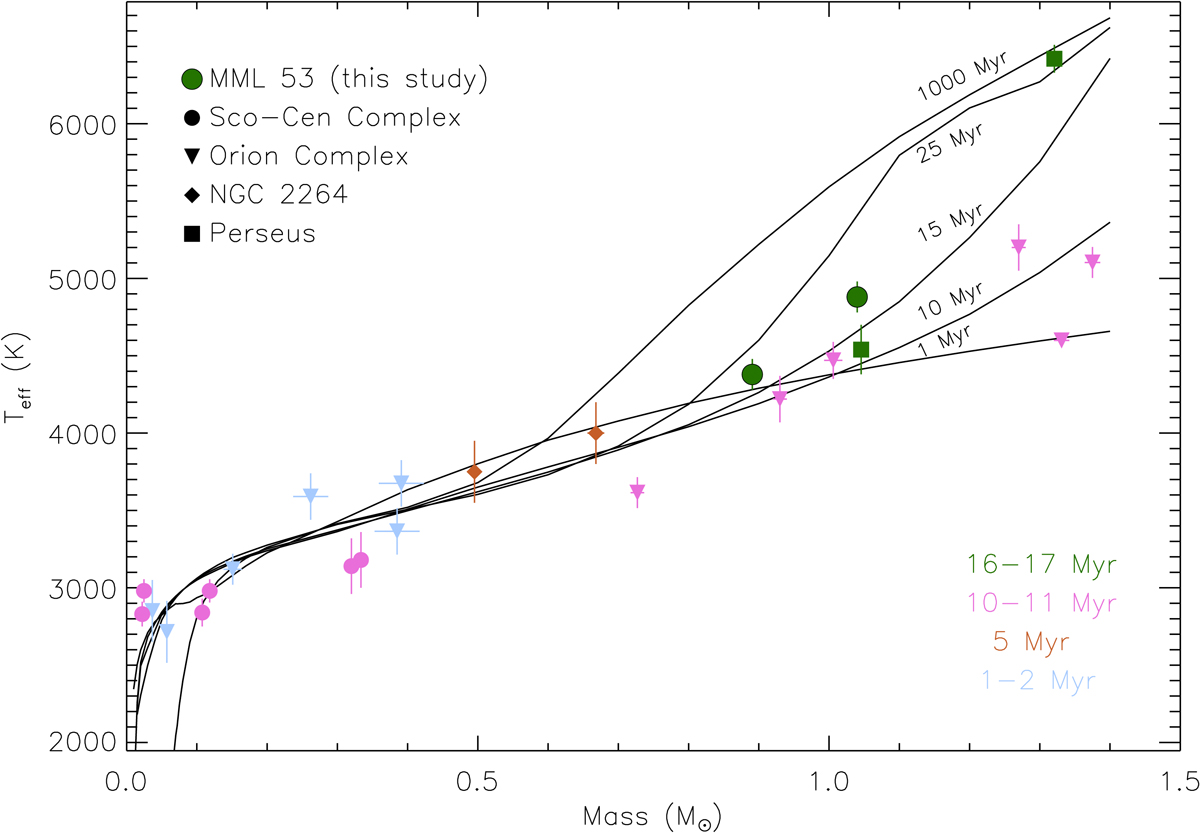
Mass–temperature diagram. We show with continuous black lines the effective temperatures for low-mass stars (< 1.4 M⊙) predicted by the models of Baraffe et al. (2015), as they evolve from 1 Myr to 1 Gyr. We compare the models to our measurements of the individual temperatures of the eclipsing components of MML 53 (green-filled circles with black edge), and the other young EBs in the literature with measured temperatures. The EBs, their symbols and colors are the same as in Fig. 11. Each black line is an isochrone, and represents the expected temperatures of stars at a given age.
Current usage metrics show cumulative count of Article Views (full-text article views including HTML views, PDF and ePub downloads, according to the available data) and Abstracts Views on Vision4Press platform.
Data correspond to usage on the plateform after 2015. The current usage metrics is available 48-96 hours after online publication and is updated daily on week days.
Initial download of the metrics may take a while.