Fig. 11.
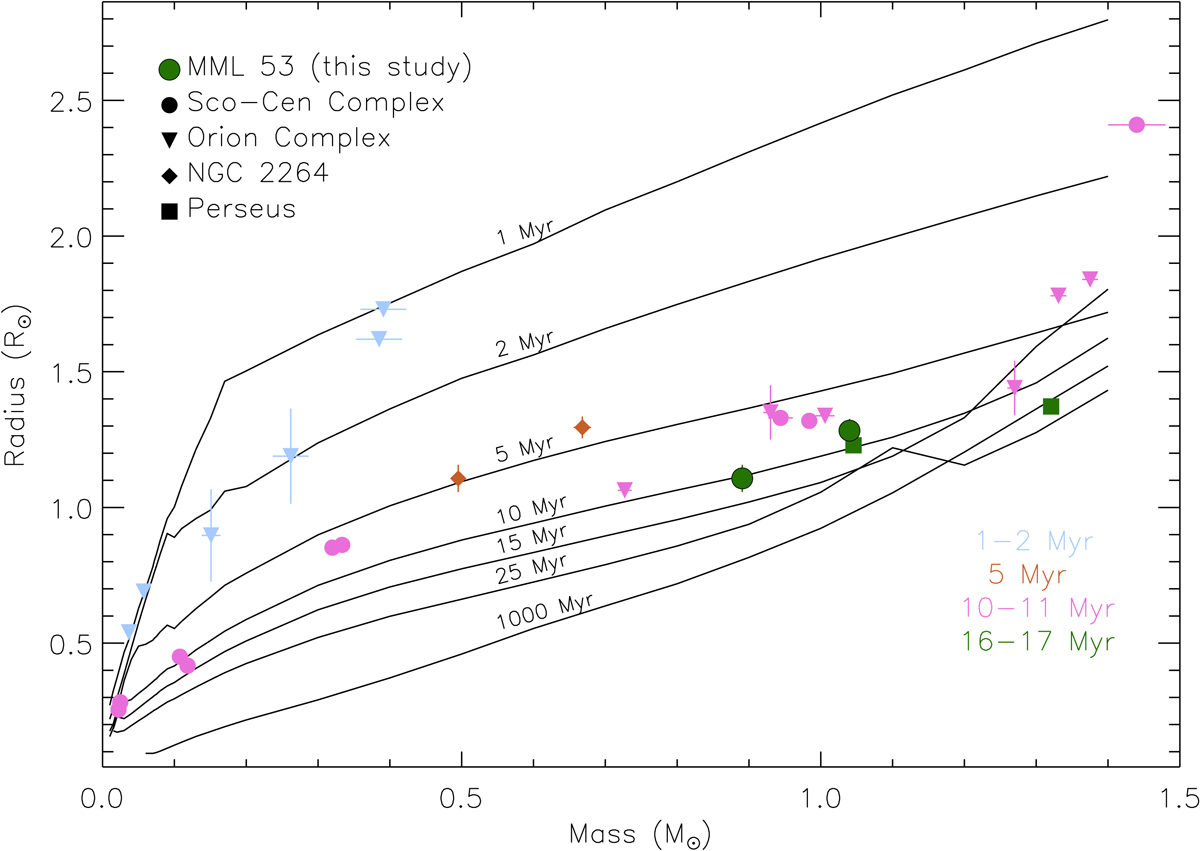
Mass–radius diagram. We compare the known pre-main sequence stars in EBs with the evolutionary models of Baraffe et al. (2015). MML 53 is shown in the green dots with black edge. We also include the measurements of the known young EB stars (top-left legend) in: the Scorpius-Centaurus complex to which MML 53 belongs (filled dots; Alonso et al. 2015; David et al. 2016); the Orion complex (filled downward triangles; Stempels et al. 2008; Covino et al. 2004; Torres et al. 2010; Gómez Maqueo Chew et al. 2012; Irwin et al. 2007; Gómez Maqueo Chew et al. 2009); NGC 2264 (filled diamonds; Gillen et al. 2014), and the Perseus complex (filled squares; Lacy et al. 2016). The color of each filled symbol represents the age of the system, as derived in previous analyses and are given in the bottom-right legend. The continuous black lines are the predicted radii of low-mass stars by the Baraffe models at different ages (from top to bottom: 1 Myr to 1 Gyr). All measurements are plotted with uncertainties; in the cases they are not visible, the uncertainties are smaller than the plotted symbols.
Current usage metrics show cumulative count of Article Views (full-text article views including HTML views, PDF and ePub downloads, according to the available data) and Abstracts Views on Vision4Press platform.
Data correspond to usage on the plateform after 2015. The current usage metrics is available 48-96 hours after online publication and is updated daily on week days.
Initial download of the metrics may take a while.