Fig. 1.
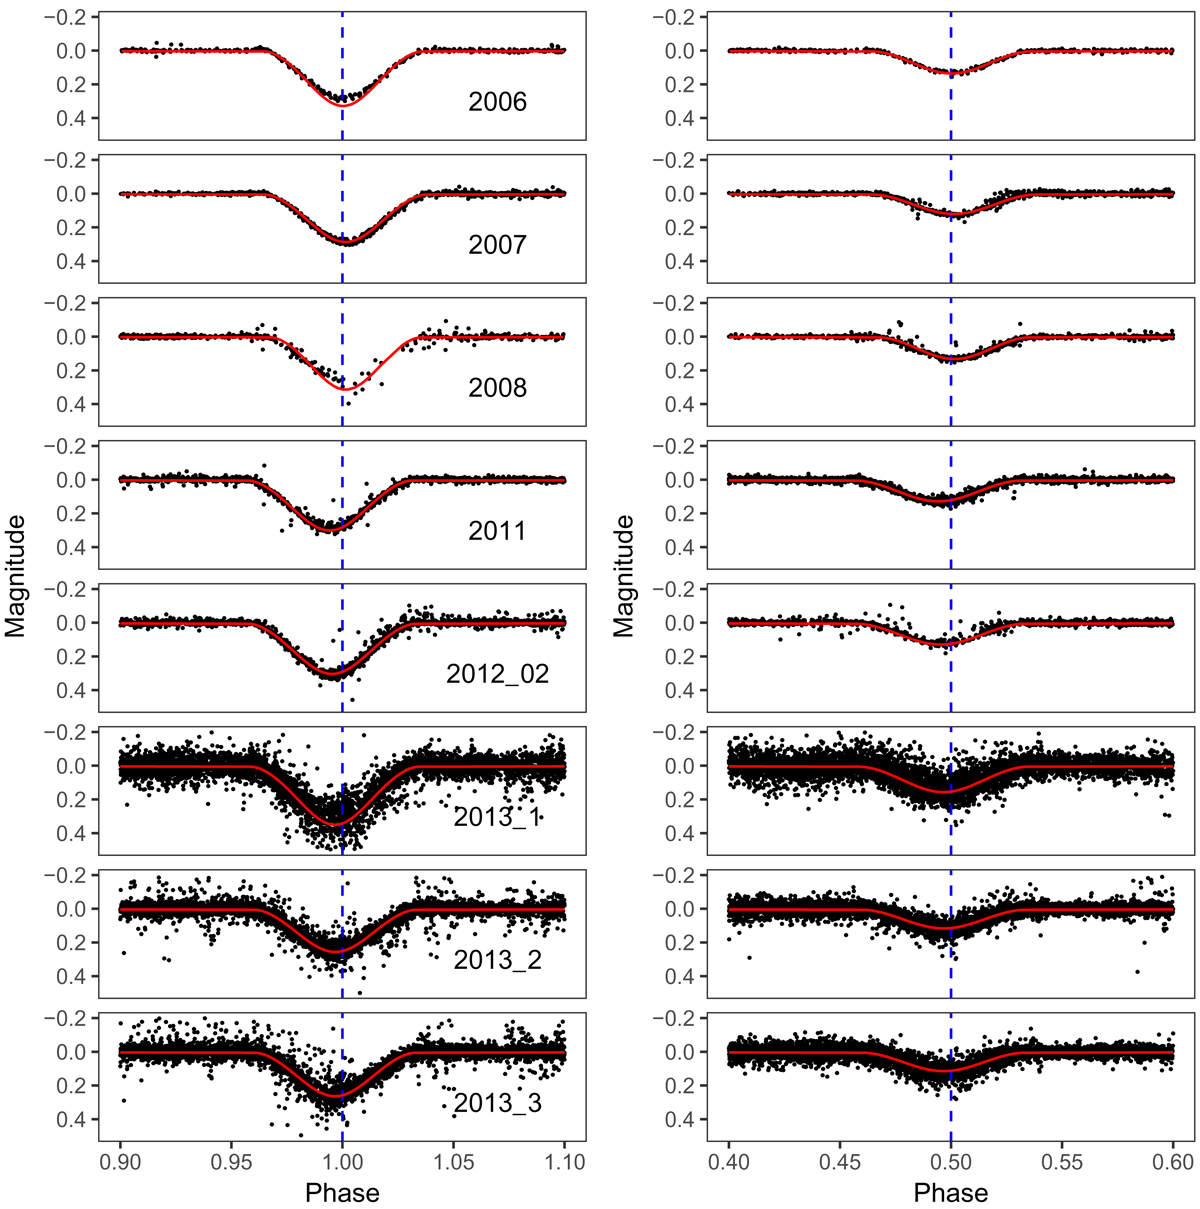
Phase-folded WASP photometry of the primary and secondary eclipses of MML 53 from 2006–2013. All data were phase-folded with the period of P = 2.097892 ± 0.000005 days, and time of minimum light in BJDTDB units, T0 = -pagination 2454972.650850, derived from the detailed modeling of the 2009 CTIO data (marked at phase 1.0 with the vertical, dashed line). Noticeable shifts in the time of eclipse minima due to the tertiary component are visible in these data. Best fitting EB model light curves (described in Sect. 3.3.1) are over plotted in red on all rectified light curves. These data are not used to derive the EB parameters, so the differing depths between the model and observed eclipses do not affect the fundamental properties of the EB derived in this paper.
Current usage metrics show cumulative count of Article Views (full-text article views including HTML views, PDF and ePub downloads, according to the available data) and Abstracts Views on Vision4Press platform.
Data correspond to usage on the plateform after 2015. The current usage metrics is available 48-96 hours after online publication and is updated daily on week days.
Initial download of the metrics may take a while.