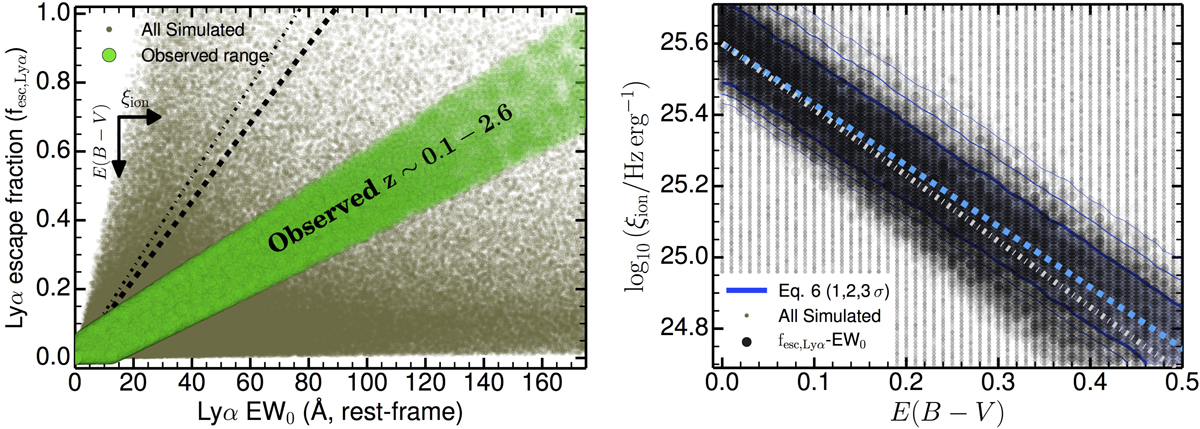
Fig. A.1.

Left: predicted relation between fesc, Lyα and Lyα EW0 for our toy model, which shows little to no correlation by sampling all physical parameters independently (see Table A.1). We also show the observed range (≈ ± 0.05) which is well constrained at z ∼ 0−2.6. We use simulated sources that are consistent with observations of LAEs to explore the potential reason behind the observed tight fesc, Lyα-EW0 correlation for LAEs. Right: by restricting our toy model to the observed relation and its scatter, we find a relatively tight ξion − E(B − V) anti-correlation for LAEs (EW0 > 25 Å): log10(ξion/Hz erg−1) ≈ −1.85 × E(B − V) + 25.6 (shown as grey dot-dashed line). This is in good agreement with the family of best fits using Eq. (6) (we show the 1, 2 and 3σ contours) which yields log10(ξion/Hz erg−1) ≈ −1.71 × E(B − V) + 25.6, with only a small difference in the slope. The highest observed EW0 correspond to the highest ξion and the lowest E(B − V), while lower EW0 leads to a lower ξion and a higher E(B − V). Our results thus show that the observed fesc, Lyα-EW0 correlation for LAEs at z ∼ 0−2.6 only allows a well defined ξion − E(B − V) sequence that may be related with important physics such as the age of the stellar populations, their metallicity, dust production and how those evolve together.
Current usage metrics show cumulative count of Article Views (full-text article views including HTML views, PDF and ePub downloads, according to the available data) and Abstracts Views on Vision4Press platform.
Data correspond to usage on the plateform after 2015. The current usage metrics is available 48-96 hours after online publication and is updated daily on week days.
Initial download of the metrics may take a while.


