Fig. 2.
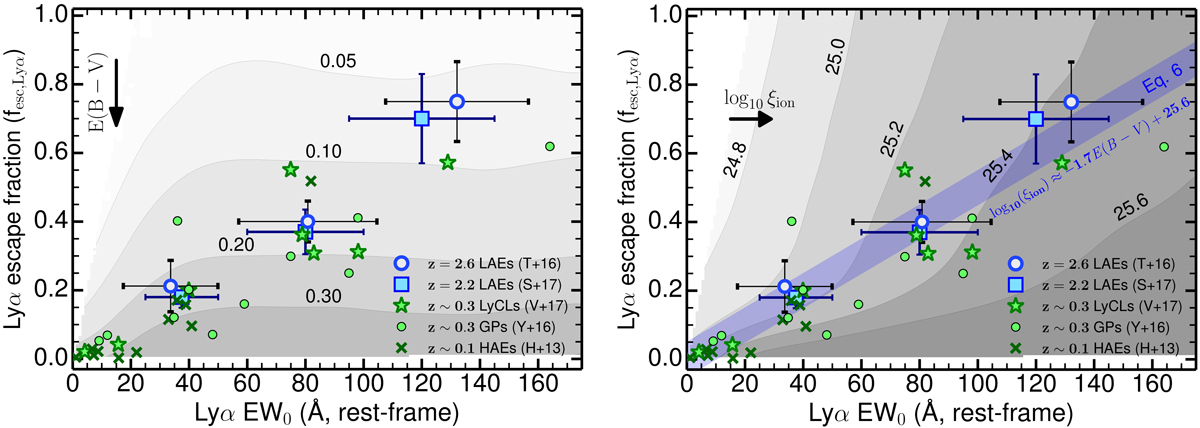
Left: predicted fesc, Lyα-Lyα EW0 space for different E(B − V) (contour levels) with our grid model (see Sect. 3.3 and Appendix A) and comparison with fits and implications by using Eq. (6) (right). We find that increasing dust extinction drives fesc, Lyα down for a fixed EW0, with data at z ∼ 0−2.6 hinting for lower dust extinction at the highest EW0 and higher dust extinction at the lowest EW0, but with the range being relatively small overall and around E(B − V) ≈ 0.05−0.3. Right: predicted fesc, Lyα-EW0 space for different ξion (contours). We find that while increasing E(B − V) mostly shifts the relation down, increasing ξion moves the relation primarily to the right.
Current usage metrics show cumulative count of Article Views (full-text article views including HTML views, PDF and ePub downloads, according to the available data) and Abstracts Views on Vision4Press platform.
Data correspond to usage on the plateform after 2015. The current usage metrics is available 48-96 hours after online publication and is updated daily on week days.
Initial download of the metrics may take a while.