Fig. 7.
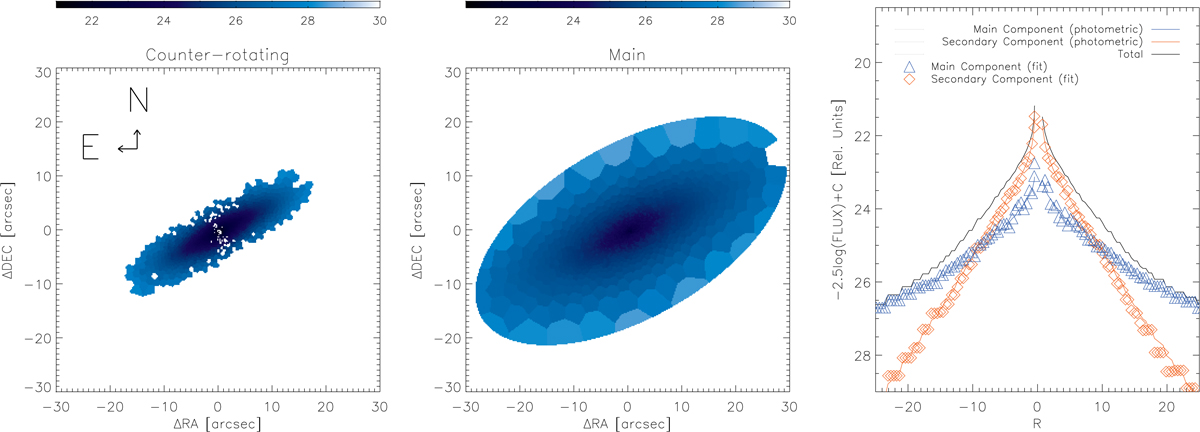
Spectral flux maps averaged over the number of spaxels and profile fixed to the one recovered by the photometric decomposition for NGC 448. Left panel: reconstructed surface brightness map of the counter-rotating component. Middle panel: reconstructed surface brightness map of the main component. Right panel: radial profile for both kinematic components, taken through a pseudo slit approximately aligned to the semi-major axis. The black, orange, and blue solid lines illustrate the photometrically derived total, counter-rotating, and main component, respectively, flux contribution. The blue triangles and the orange diamonds show the flux contribution derived of the counter-rotating and main components as derived through our fitting procedure without imposing any constraints.
Current usage metrics show cumulative count of Article Views (full-text article views including HTML views, PDF and ePub downloads, according to the available data) and Abstracts Views on Vision4Press platform.
Data correspond to usage on the plateform after 2015. The current usage metrics is available 48-96 hours after online publication and is updated daily on week days.
Initial download of the metrics may take a while.