Fig. 1.
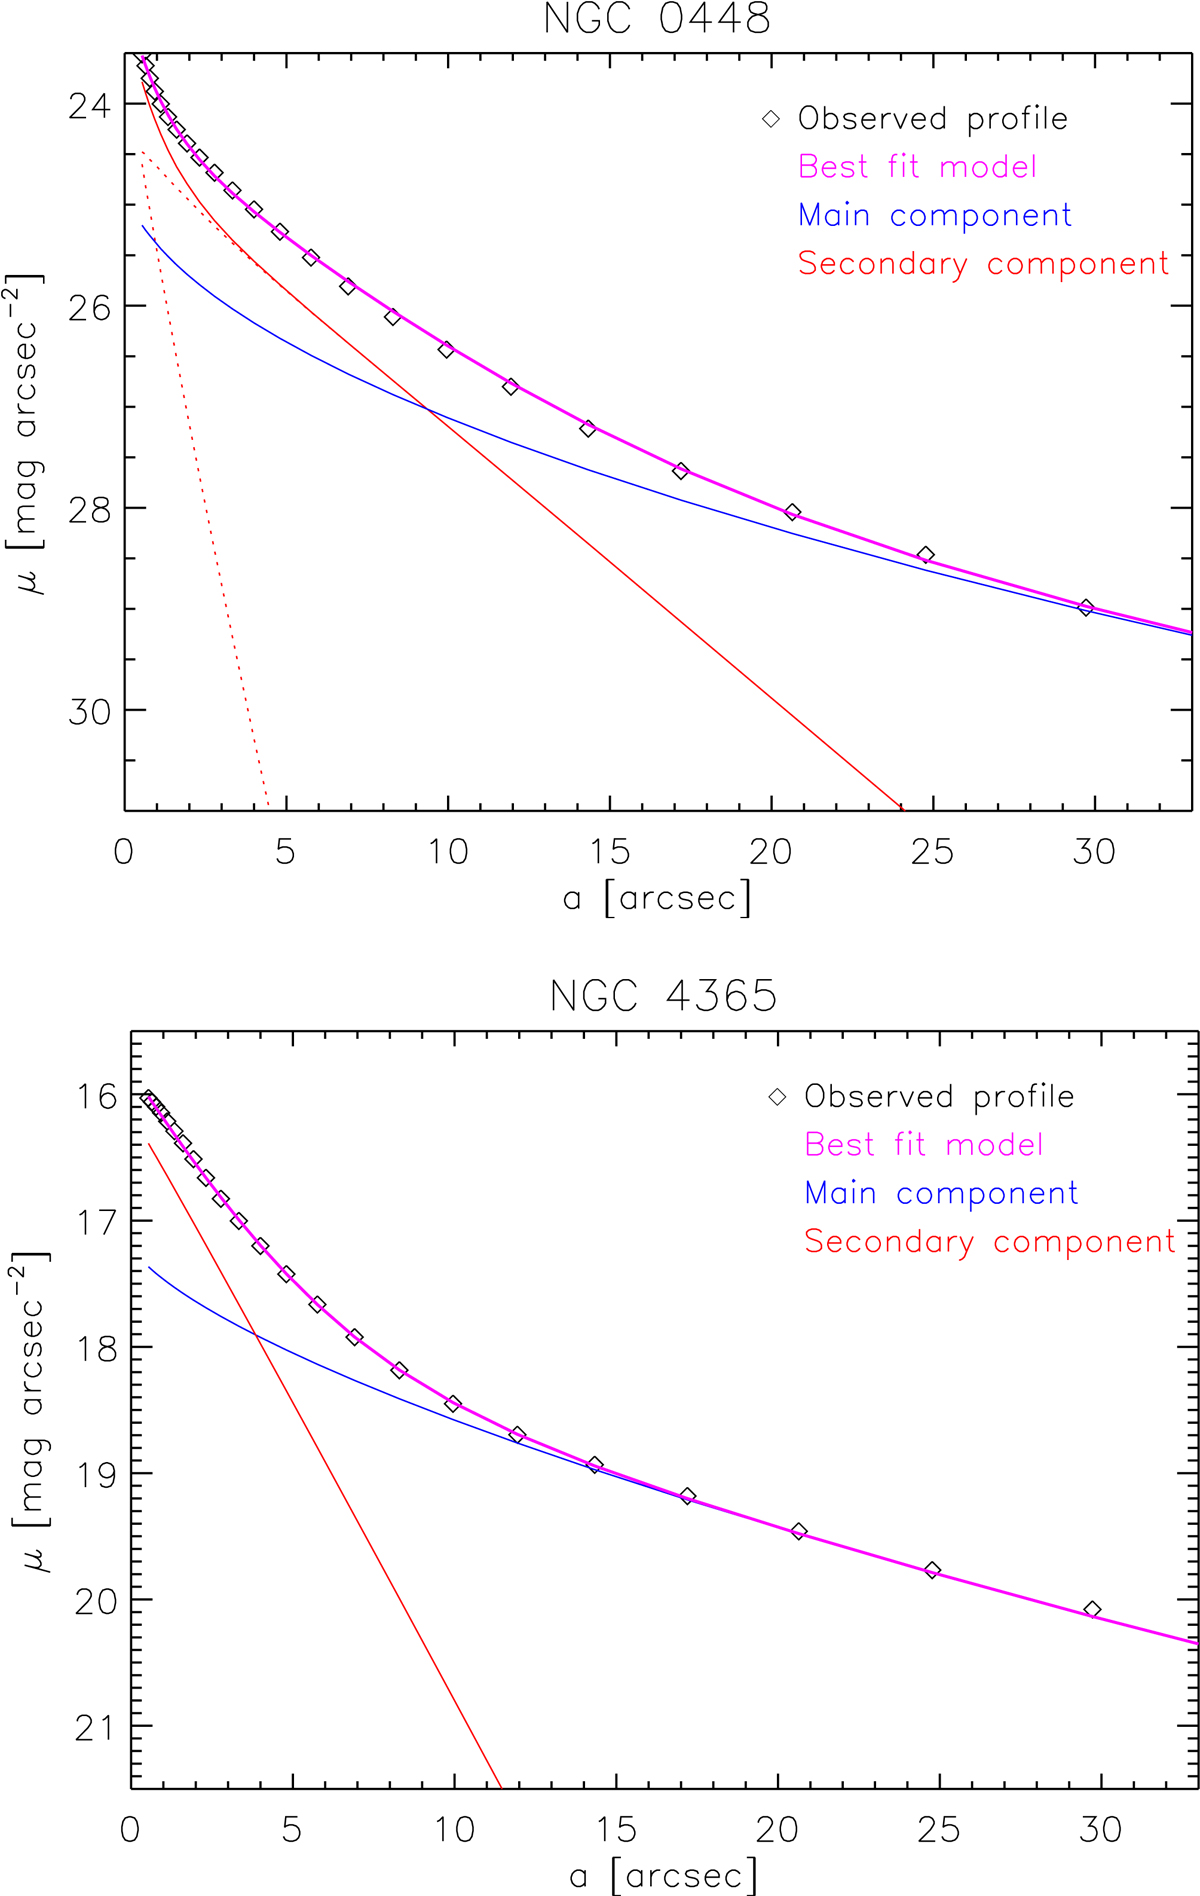
Photometric decomposition for NGC 448 (upper panel) and NGC 4365 (lower panel). Each plot shows: the surface brightness profile measured from the reconstructed images (diamonds), the best fit model (magenta) as obtained from the combination of the structural components that are associated to the main galaxy (blue) and to the kinematically distinct core (KDC, labelled as “secondary component”, in red). In the case of NGC 448, the KDC is assumed to include two subcomponents (dashed red lines).
Current usage metrics show cumulative count of Article Views (full-text article views including HTML views, PDF and ePub downloads, according to the available data) and Abstracts Views on Vision4Press platform.
Data correspond to usage on the plateform after 2015. The current usage metrics is available 48-96 hours after online publication and is updated daily on week days.
Initial download of the metrics may take a while.