Free Access
Fig. A.2
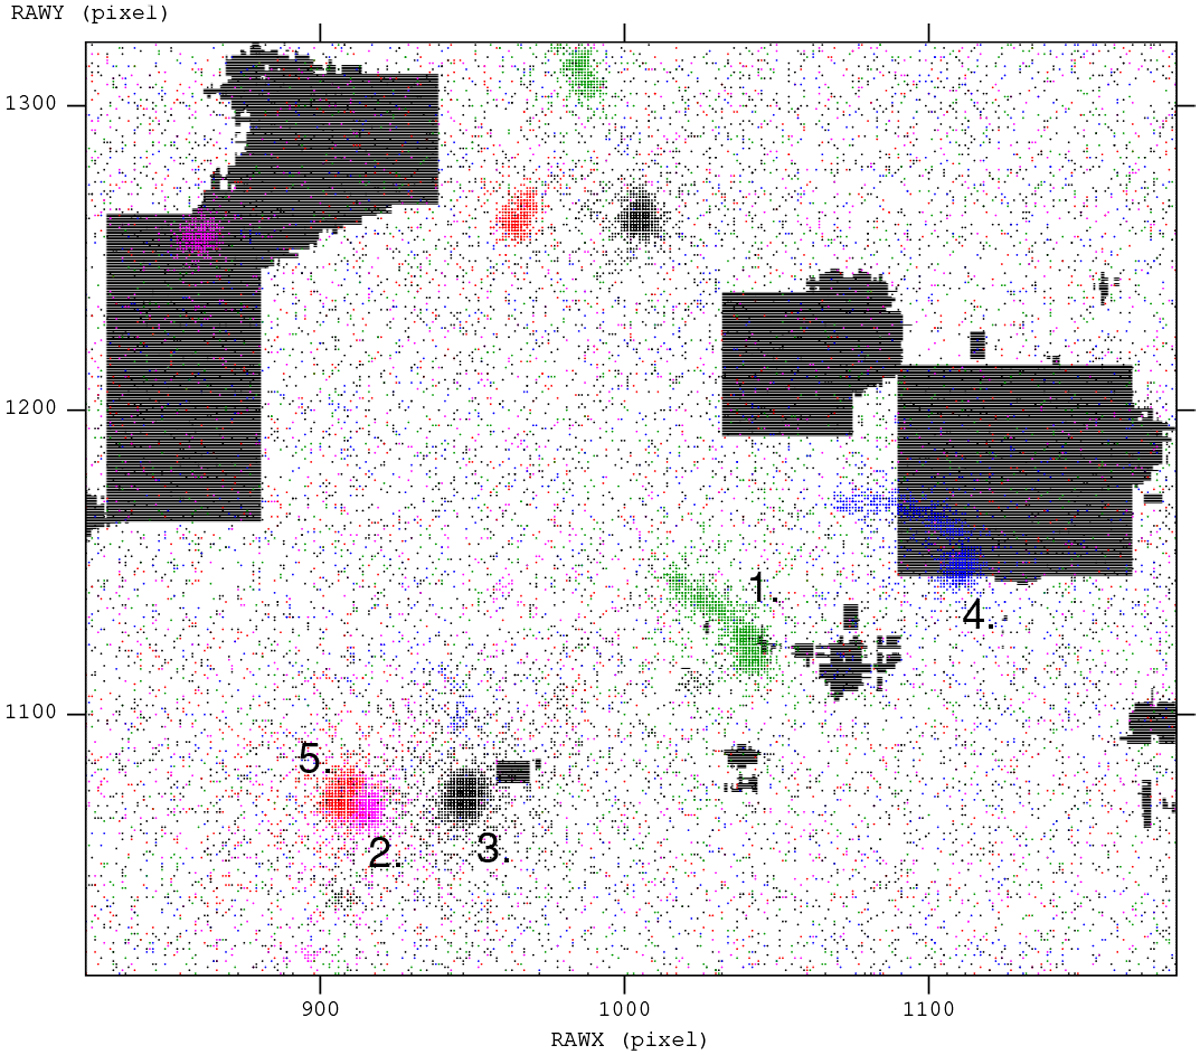
Source positions in raw detector coordinates during exposures affected by low-sensitivity patches. The figure shows a central region of the UVOT; known bad patches are shaded. The source positions are numbered according to Fig. A.1. The aimpoint was close to the XY position 935 and 1060 in raw detector coordinates.
Current usage metrics show cumulative count of Article Views (full-text article views including HTML views, PDF and ePub downloads, according to the available data) and Abstracts Views on Vision4Press platform.
Data correspond to usage on the plateform after 2015. The current usage metrics is available 48-96 hours after online publication and is updated daily on week days.
Initial download of the metrics may take a while.