Free Access
Fig. A.1
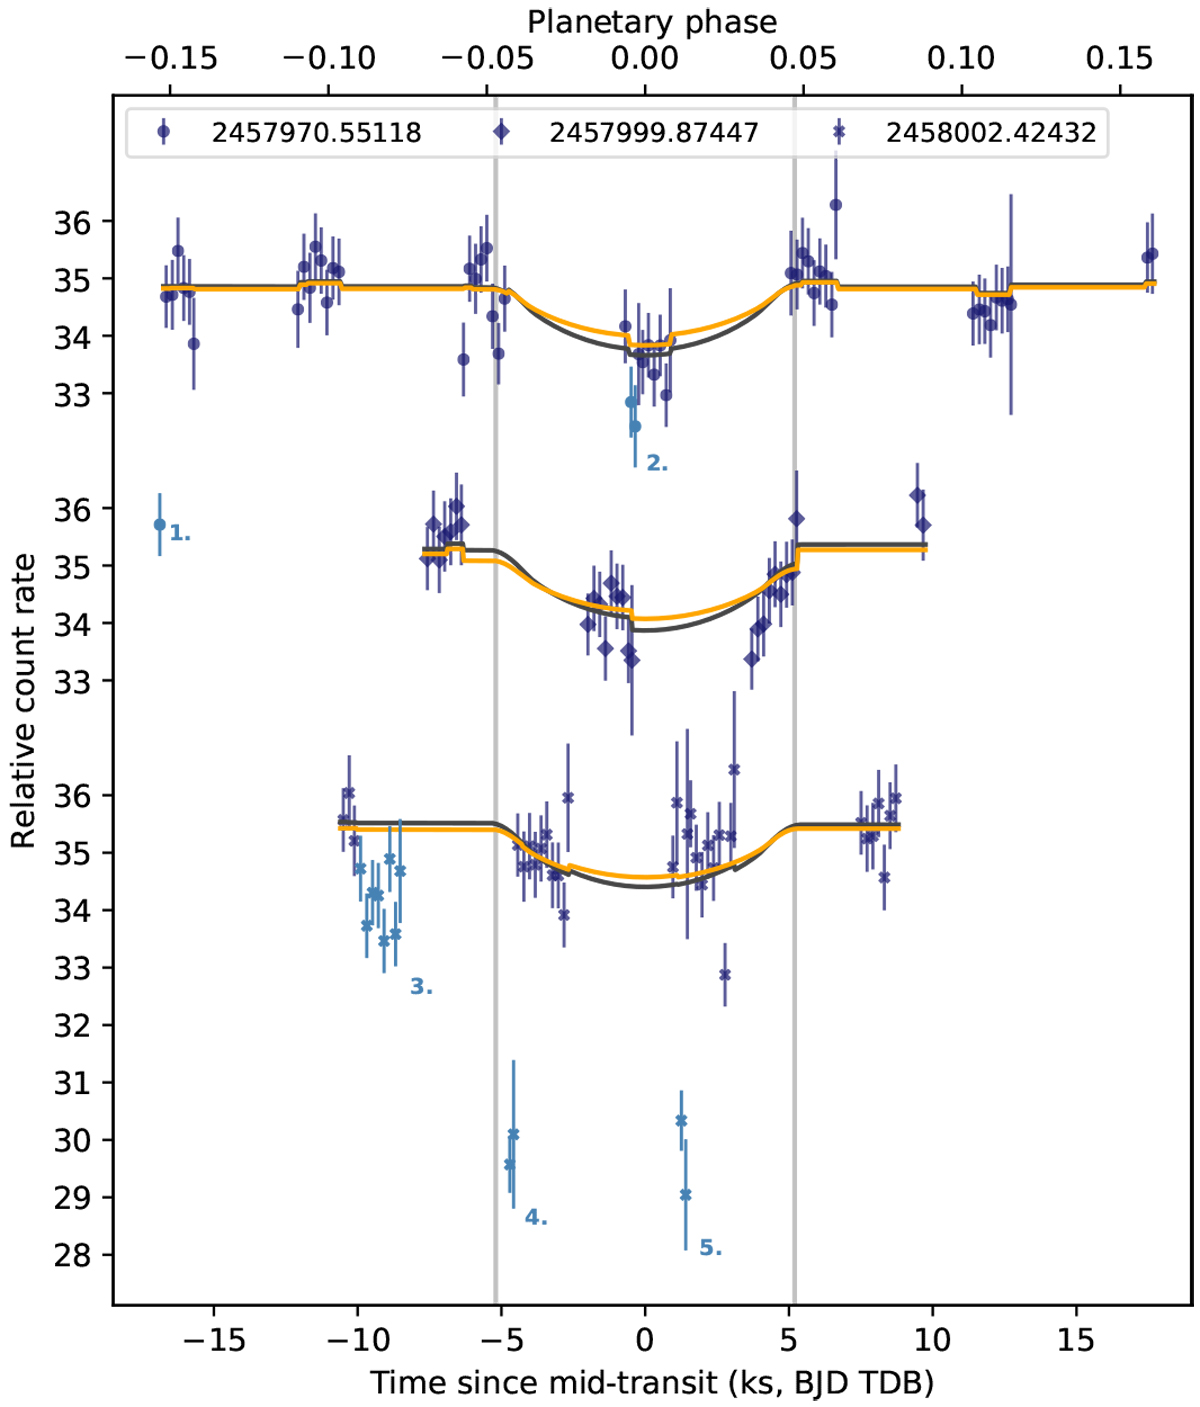
Transit light curves of WASP-121 with our model including the offsets caused by instrument systematics (black curve). A model with the transit depth fixed to the broadband optical value is shown by the orange line. Exposures discarded due to low-sensitivity patches are indicated; see labels 1–5.
Current usage metrics show cumulative count of Article Views (full-text article views including HTML views, PDF and ePub downloads, according to the available data) and Abstracts Views on Vision4Press platform.
Data correspond to usage on the plateform after 2015. The current usage metrics is available 48-96 hours after online publication and is updated daily on week days.
Initial download of the metrics may take a while.