Fig. 4
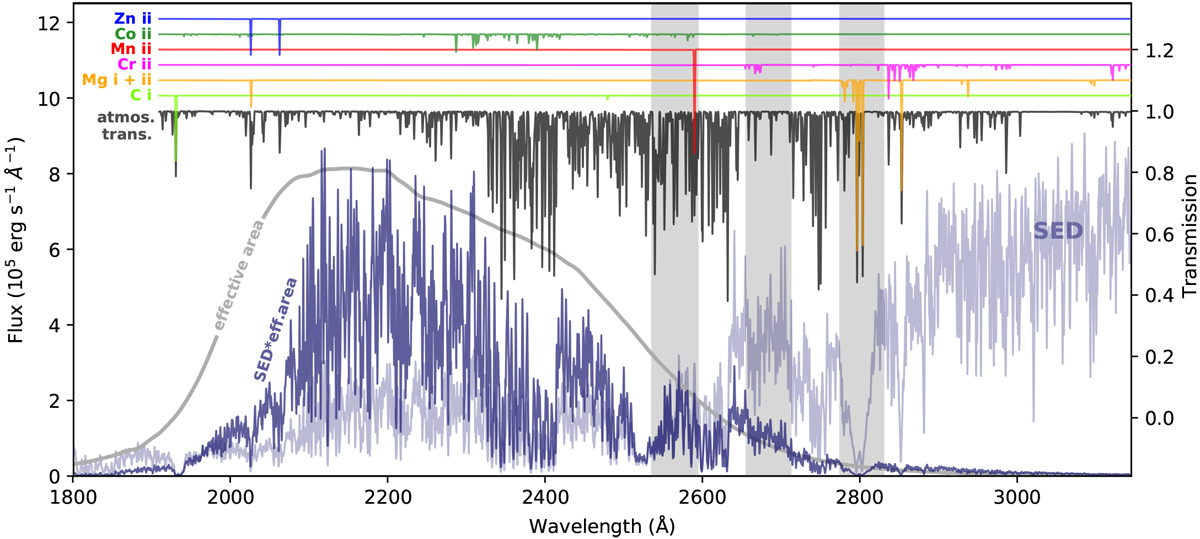
Model of the SED of WASP-121 at the distance of the planet (light blue). The effective area of the instrument-filter combinationand its multiplication with the stellar spectrum are depicted in arbitrary units. An atmospheric transmission model is depicted in black and contributions of individual ions are shown above – all remaining lines are caused by Fe II. Ranges covered by HST COS observations of WASP-12 are shaded. All spectra are shown at a resolution of 3000, the nominal resolution of the CUTE cubesat (Fleming et al. 2018).
Current usage metrics show cumulative count of Article Views (full-text article views including HTML views, PDF and ePub downloads, according to the available data) and Abstracts Views on Vision4Press platform.
Data correspond to usage on the plateform after 2015. The current usage metrics is available 48-96 hours after online publication and is updated daily on week days.
Initial download of the metrics may take a while.